Technical Analysis: Week 16, 2025
(Gold | EUR/USD | AUD/USD)
Welcome to your weekly edge in the markets, brought to you by WeTrade in collaboration with Trading Writers.
This report is designed to give you clear, actionable insights each week. It’s split into two parts:
- Weekly thoughts – practical trading strategies, tips, and educational ideas to help sharpen your skills.
- Setups & signals – our top 3 trade ideas for the week, complete with charts and key levels to watch.
Weekly Thoughts
Trying to pick a top of any market is often a fool’s errand. So let’s be foolish! (kidding)
To be clear, the trend is up in gold. However we think we could be close to a top.
For three reasons:
- The price has gone parabolic
- Everybody’s talking about buying gold
- Everybody's talking about selling the US dollar
- Traders have short term memories
- and it’s usually around these times that a blow off top is formed.
A blow-off top is a sharp, accelerated price surge that happens at the end of a strong uptrend - usually followed by a fast and violent reversal.
It’s driven by panic buying, FOMO, and euphoric sentiment. It often marks the final stage of a bull run when late buyers fuel the last push higher, only to get trapped as the market turns.
By the way, this doesn’t need to be the ‘final’ top for many years - just a top for the time being that creates a tradable correction in price.
The trend is our friend, until it ends. It’s very rare that there is any justification for selling in an uptrend or buying in a downtrend. Momentum very often carries the price much further than we can imagine.
Right now gold is trading at a record high, just shy of $3400 per oz.
Could you have imagined it would be here THREE weeks ago when it was under $3000 per oz?
Or at the start of the year when it was $2600 per oz? Probably not - it has risen really quickly.
But now after this quick run up, traders start to adjust their thinking. Whereas an $800 move in 3 months seemed crazy before, now it starts to be expected. Forecasts of $4000 per oz this year are now being touted by professional analysts.
Of course, this giant rally in gold can continue- and that’s the risk we have to deal with if looking to go short.
It’s very important that we don’t ‘guess’ where the top might be in gold. You might think $3500 per oz would be a nice round number to sell, but the same could have been said about $3000!
What we need is some confirmation from the market that the bullish gold trade has gotten too crowded.
We have broken down this setup into 3 parts, you will remember these from week 13.
The Logic Behind the Trade
We’re not calling a top in gold, we’re watching for signs that one might be forming. Here’s the 3-part framework we’re using:
- The Setup
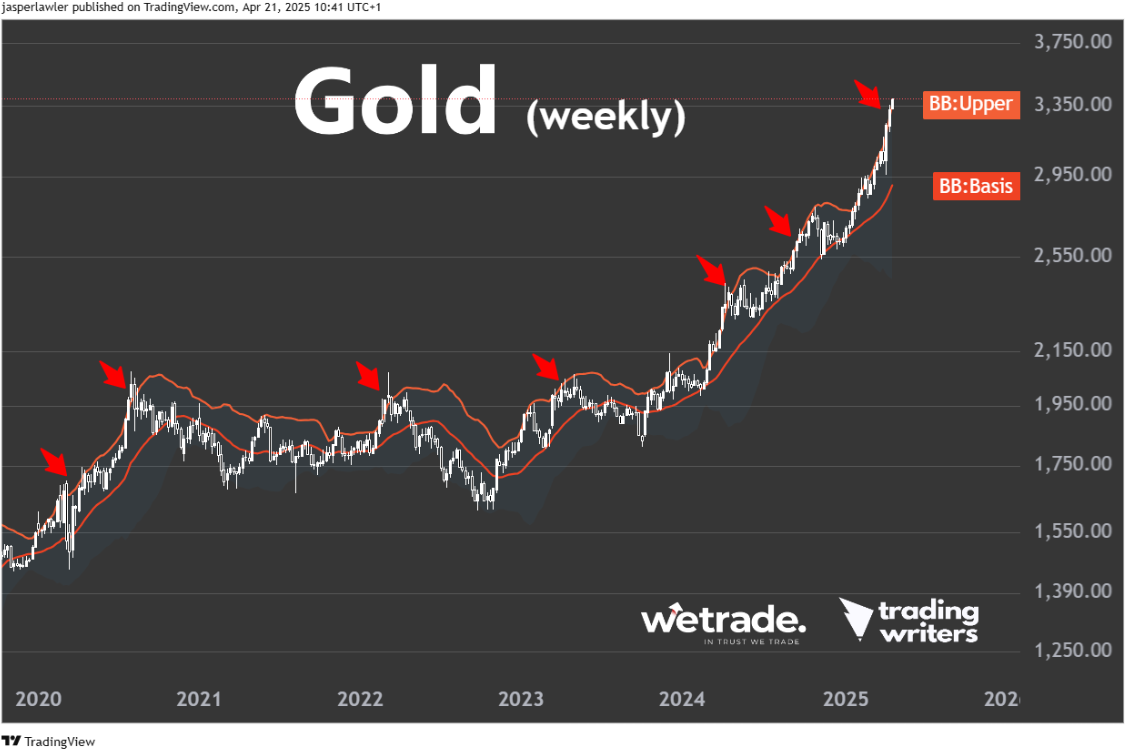
Gold has been trading more than 3 standard deviations above its mean for three weeks straight. We can use the Bollinger bands on the chart to see that. Statistically, that’s extreme. Price is stretched far beyond its average—like a rubber band pulled too tight. When everyone’s long, the risk is that there’s no one left to buy.
- The Signal
We want to see a down day in gold—a lower close, despite good news (e.g., weak US econ data, geopolitics). That tells us buyers are losing conviction, even when the environment still should support higher prices. It’s a sign that the trade is getting crowded and the market is tired.
- The Trigger
If that down day is followed by a break below its low, we have our entry. That’s confirmation that momentum has shifted and a deeper pullback may be starting. Until then, we wait—no need to guess.
In case you’re questioning our logic, I would just mention the similar setup we mentioned in the DAX 40 index in week 12’s analysis. The DAX was trading at 23,000 and we indicated it looked overbought and is due a correction to its 30 week MA around 21,000. Trump helped the idea! - sending it to our target within one week - it eventually bottomed at 19,000.
Setups & Signals
We look at hundreds of charts each week and present you with three of our favourite setups and signals.
Gold
Long term chart (weekly)
Trend: Up
Phase: Blow off top?
Resistance = 3500
Support = 2600
Price action: The chart shows the last several occasions when gold got this ‘stretched’ on the upside going back five years. There is usually at least a consolidation that follows, and occasionally it sets up a larger correction.
View: Bearish (after setup)
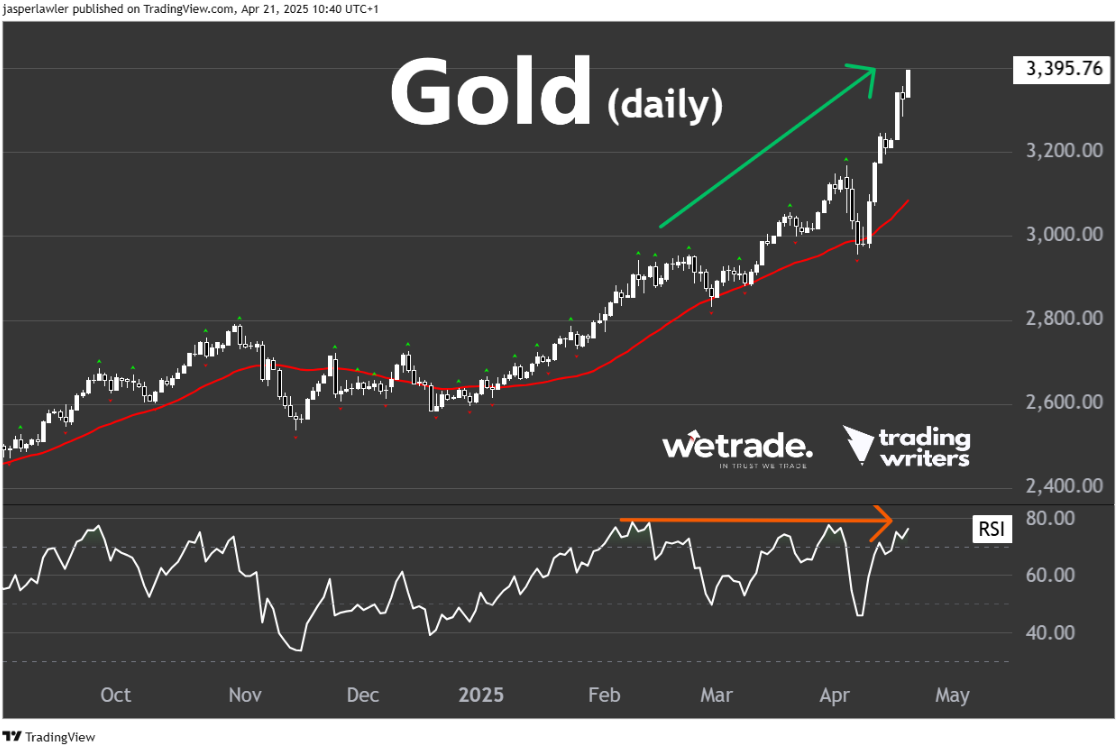
Medium term chart (daily)
Trend: Up
Phase: Getting parabolic
Resistance = 3400
Support = 3000
Price action: Following a dip under $3000 and its 30-day moving average, gold thundered higher to hit multiple record highs last week. There is bearish divergence with higher highs in price being matched with equal highs on the RSI.
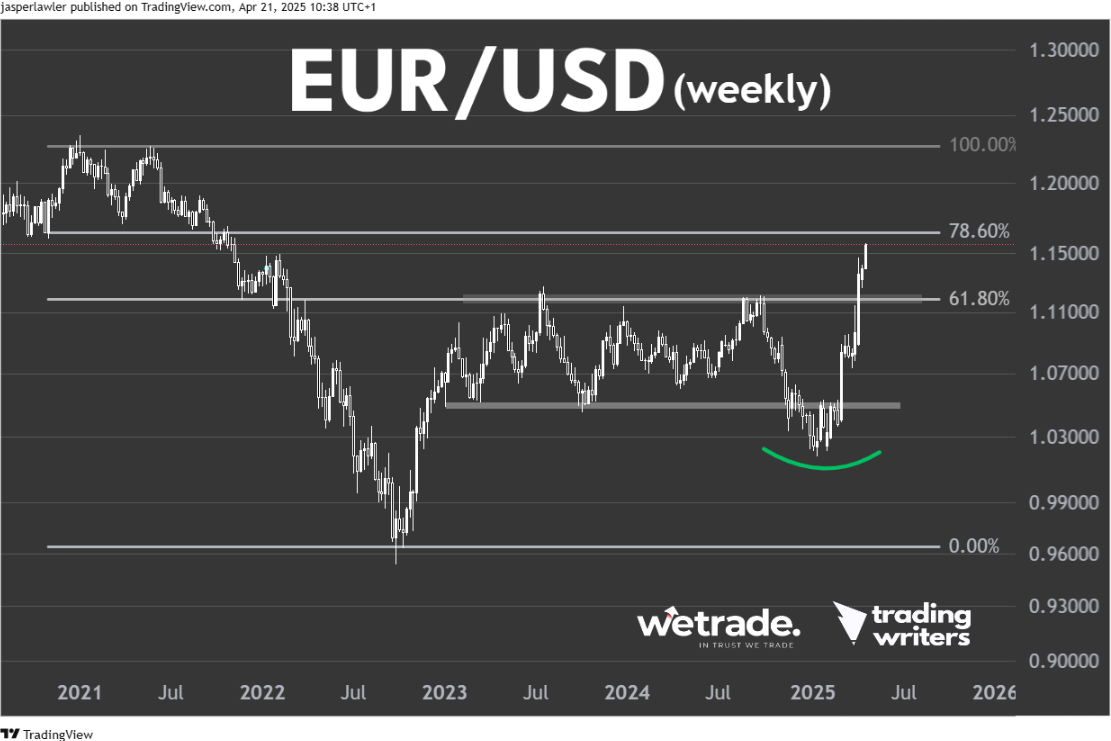
EUR/USD
Long term chart (weekly)
Trend: Up
Phase: Range breakout
Resistance = 1.2250
Support = 1.12
Price action: The price has continued to surge above its former range high, taking it further into a new uptrend. The 78.6% Fibonacci retracement of the 2021-22 decline could offer next resistance before a full 100% retracement.
View: Bearish while below 10.000
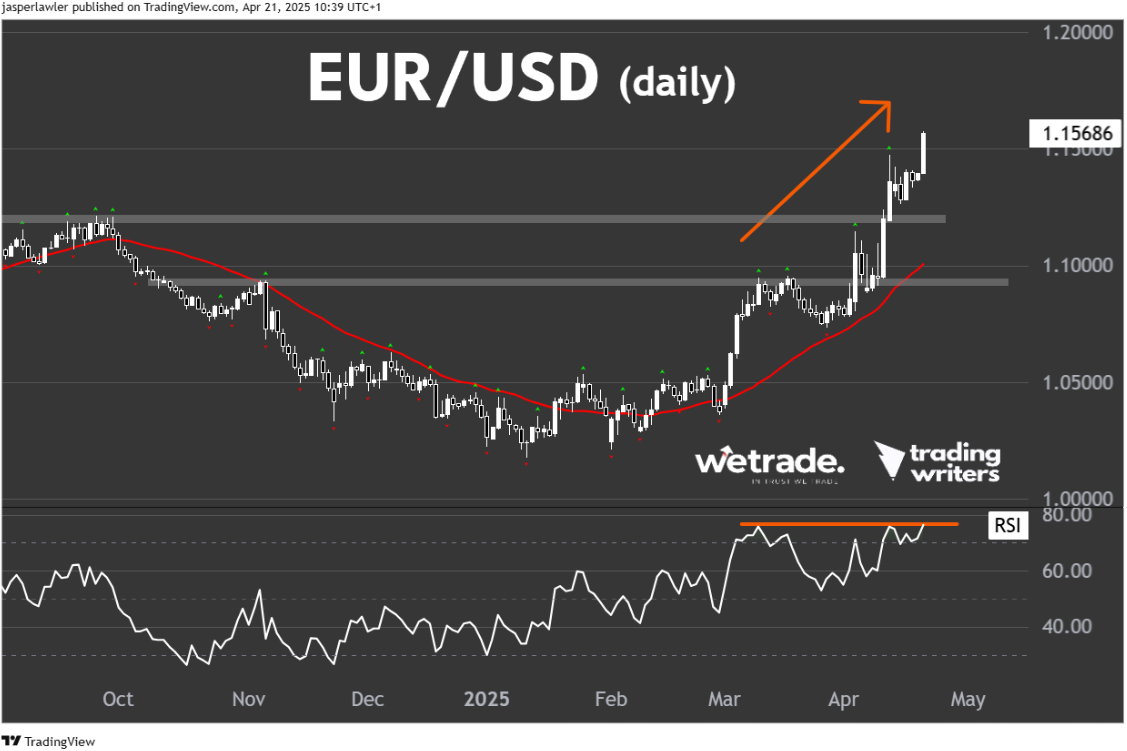
Medium term chart (daily)
Trend: Up
Phase: 3rd wave of uptrend
Resistance = 1.1650
Support = 1.14
Price action: The price is in a clear uptrend with clear blue skies above on the daily chart, trading at 3 year highs. The price looks over-extended vs the 30-day SMA and there is bearish divergence on the RSI.
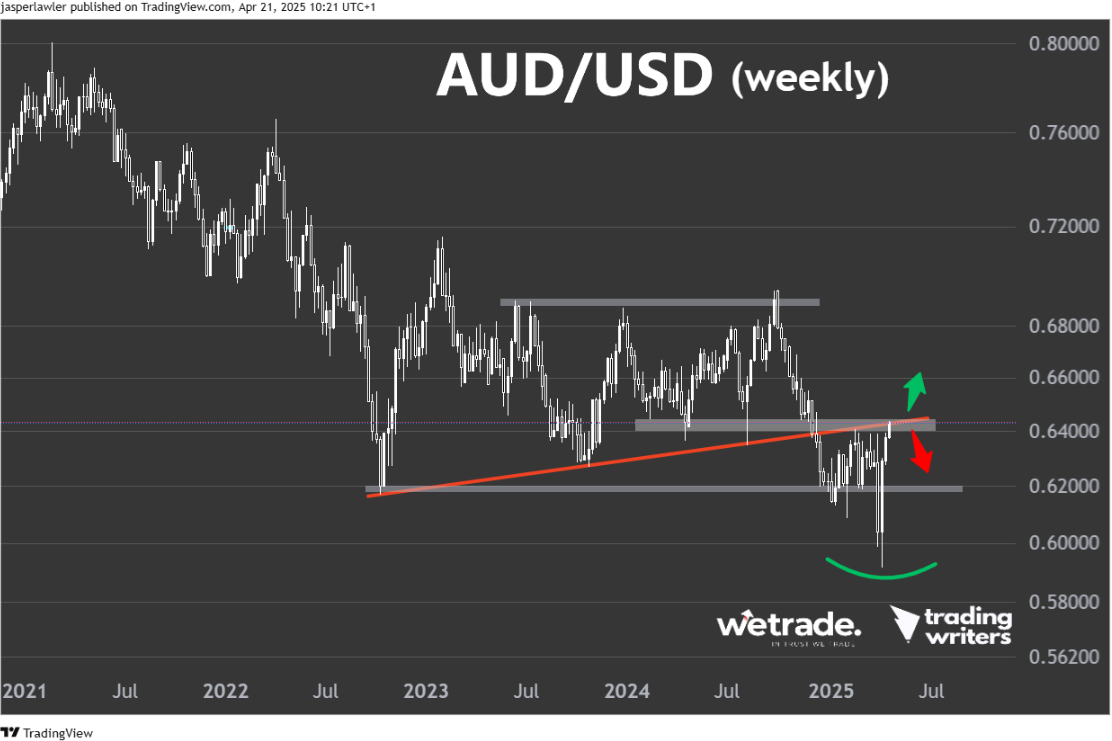
AUD/USD
Long term chart (weekly)
Trend: Down
Phase: Rebound/Reversal
Resistance = 0.69
Support = 0.60
Price action: Interesting because Aussie still in a long term downtrend vs the dollar. So if the dollar rebounds - its in line with the trend in AUD/USD. However, the false breakdown under 0.62 and huge 2 week reversal suggests possible long term bottom.
View: Bearish, neutral on break over 0.64
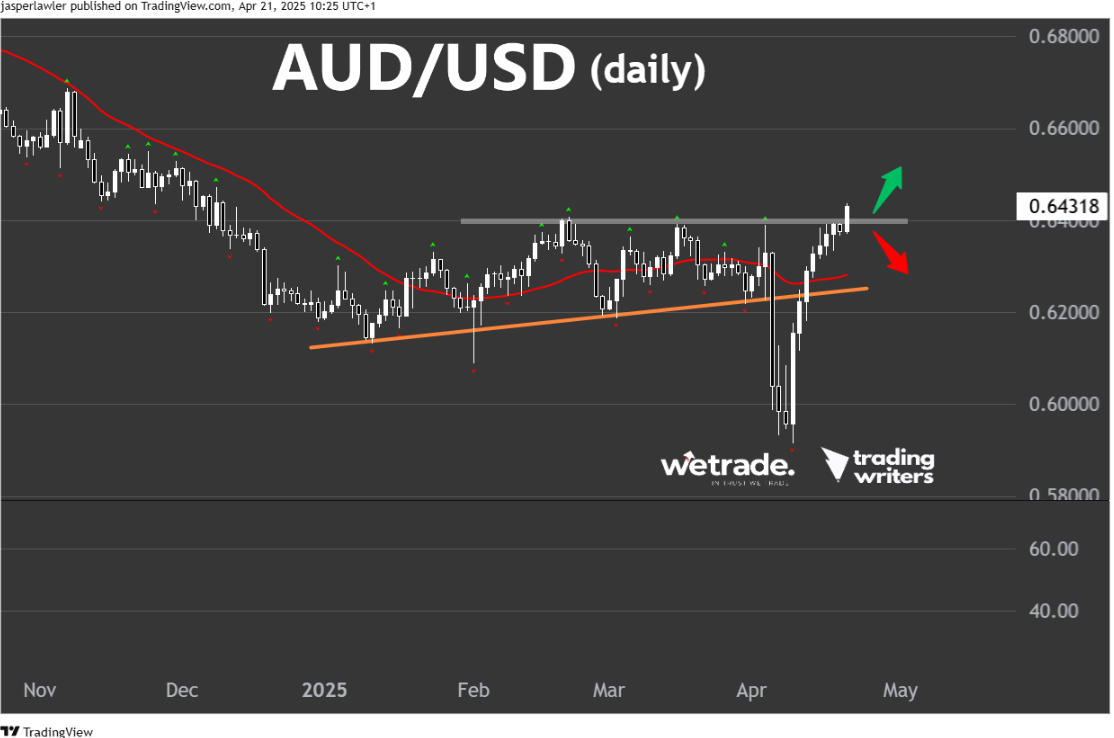
Medium term chart (daily)
Trend: Sideways
Phase: Possible breakout
Resistance = 0.65
Support = 0.64
Price action: The price closed higher 7 days in a row in a 400 pip rally. Possible breakout but price looks exhausted and could result in a ‘fakeout’ and possible short from around 0.64 down to 0.62 or lower to retest prior low near 0.60.
But - as always - that’s just how the team and I are seeing things, what do you think?
Share your ideas with us - OR - send us a request!
Trade with WeTrade!
Every position closed is one step closer to unlocking WeTrade Honours privileges and redeeming exclusive rewards.
Start your trading journey here - Register now
Kickstart your trading of the week here - Login Now