We are again turning to USD/CAD this week for an exercise in patience, humility and the ability to admit when you’re wrong.
If you can admit you’re wrong, you can close a trade that’s not working. And why is that important? Because you want to be ready for the trade that will go right.
USD/CAD
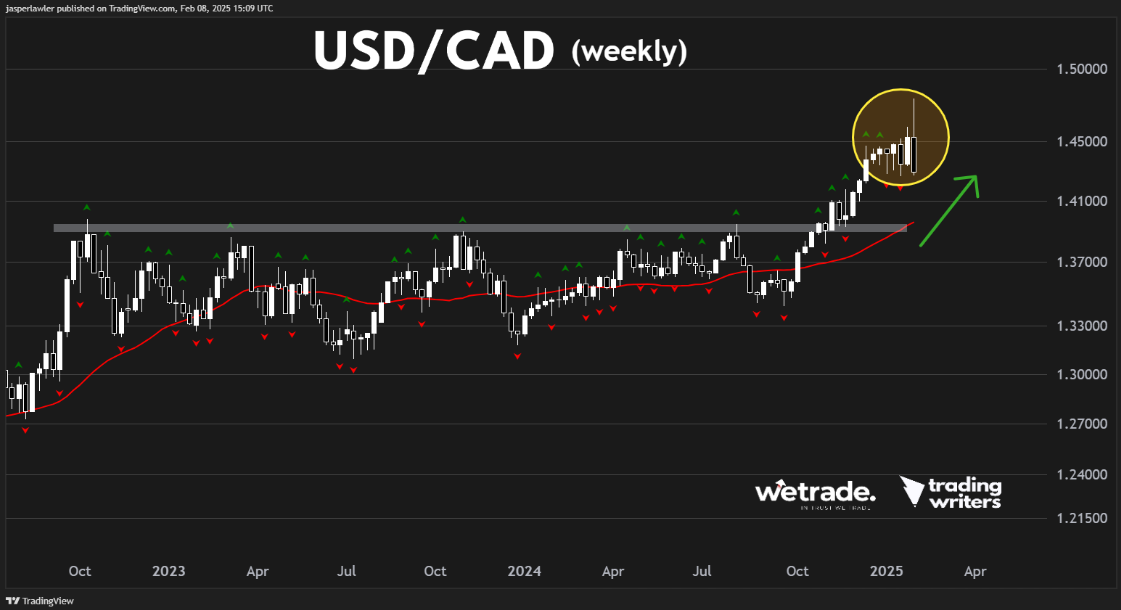
USD/CAD is in an uptrend and we’ve been looking to trade the breakout higher. There were a couple of fakeouts but we were not getting deterred. Taking small losses before the big winner is something breakout traders have to accept as a fact of life.
Another thing they have to accept is when the breakout fails altogether. That seems to be just what happened in USD/CAD.
‘Loonie’ just put in a huge weekly engulfing candlestick in which the body engulfed the prior 7 weeks. That is a bearish development that suggests to us that the breakout above 1.45 is not happening anytime soon.
The daily chart shows that USD/CAD dropped 500 pips in two days.
There is a good chance that the pair continues its fall from here but the poor risk:reward means we won’t be participating in the downside.
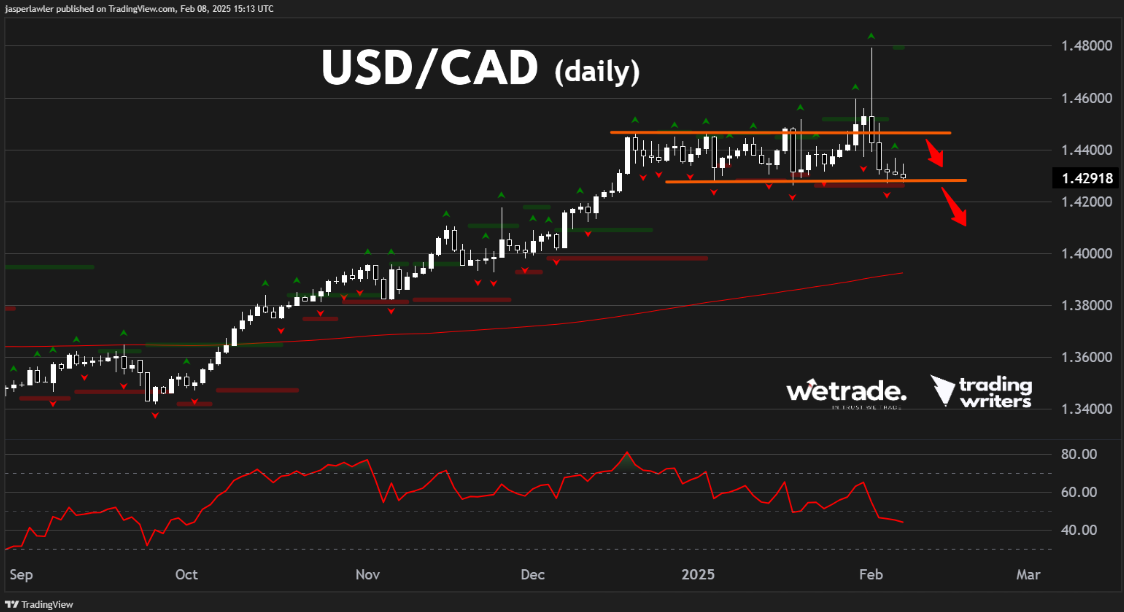
One way to approach this would be to wait for a rebound to and rejection of former resistance around 1.4470. The formation of a lower high would offer a more reasonable place to put stop losses on any short orders vs the peak at 1.48.
EUR/JPY
Now it’s time to be a bit more upbeat!
While USD/CAD has been a ‘cost of doing business’ - EUR/JPY has been a chance to ‘collect revenue’ by calling the market right.
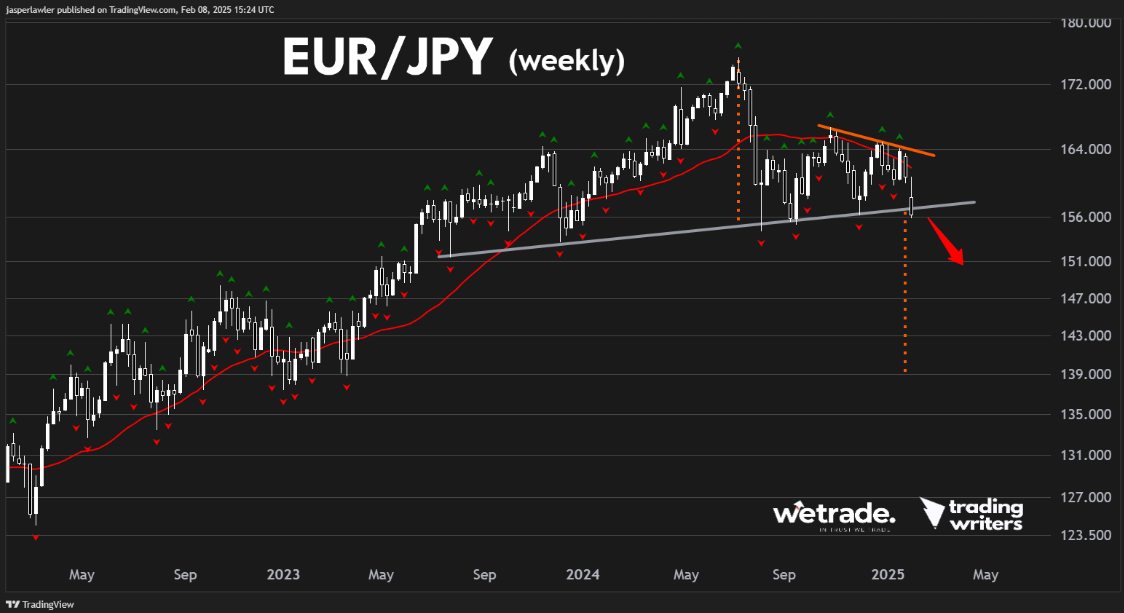
We mentioned EUR/JPY in week 1, 2025. But our bearish call began back in week 41, 2024 (in early October) when we called the now COMPLETED Head and Shoulders reversal pattern before the right shoulder had even formed.
We are interpreting the breakdown from the neckline of the pattern (rising trendline) to bring about an eventual drop toward 139.0. This is the minimum price objective based on the height of the pattern.
While the big picture looks bearish, in the short term we need to get the position on, which will be subject to noise.
The 155.0 level is major support and could create a bounce up towards broken supports at 158 and 159.7.
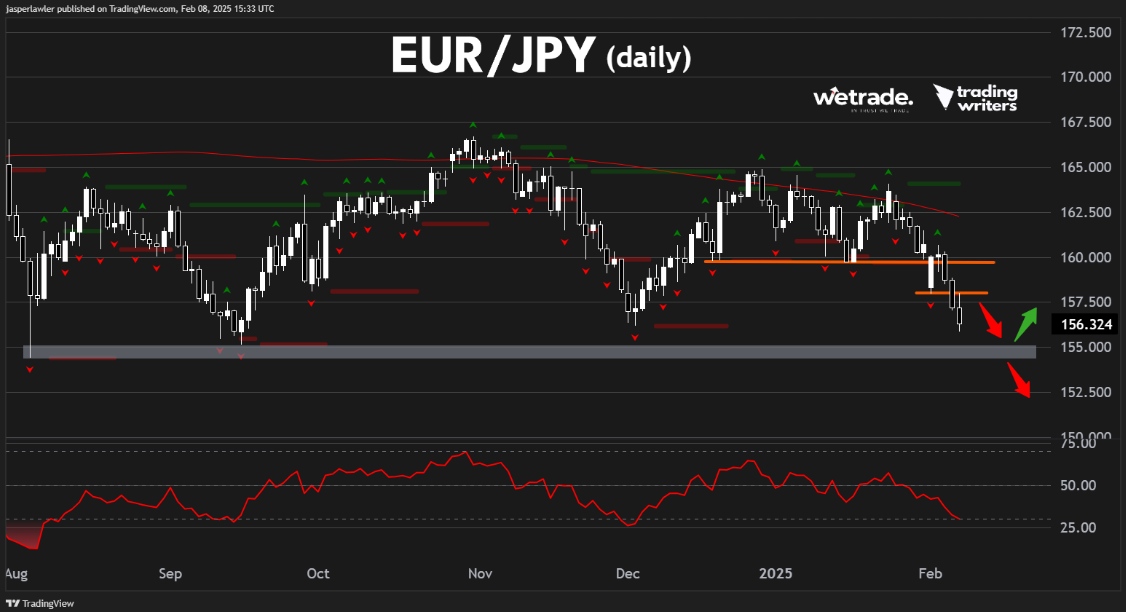
However a break below 155 opens up further downside with risk well defined by the neckline of the weekly head and shoulders pattern.
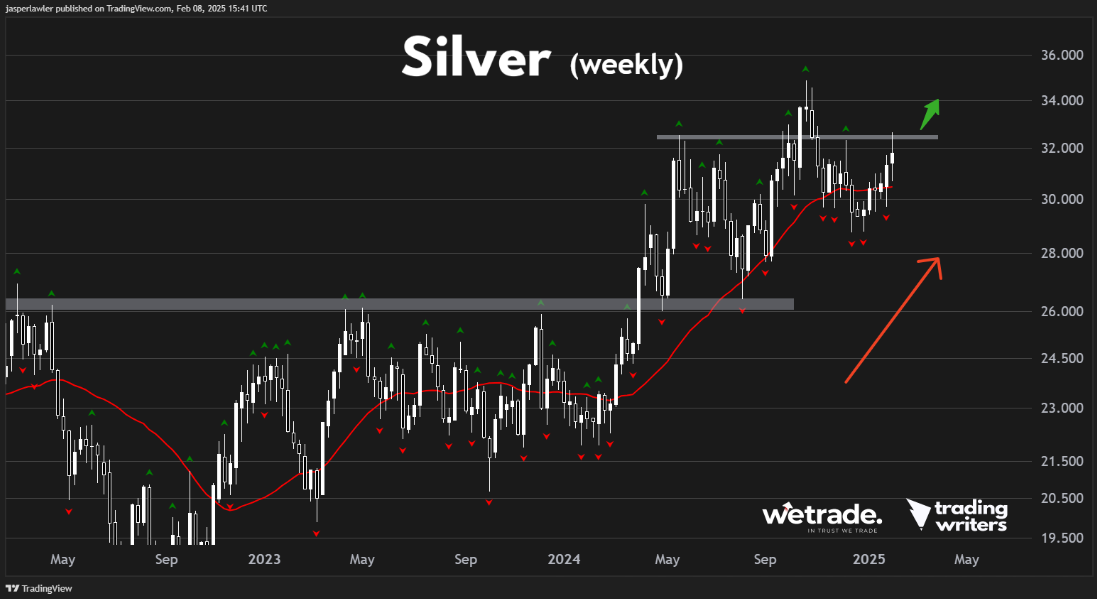
Silver (XAG/USD)
Actually the big metal mover of last week was copper. But we think that could be a good thing for silver, which could also benefit from a rotation out of gold after touching a record high last week.
On the weekly chart XAG/USD is testing major resistance at $32.50 per oz. That comes after a false breakdown below the 30 week moving average.
Our bias is bullish but so far silver hasn’t done much to give us much conviction about it.
On the daily chart the price needs to break resistance at 32.30.
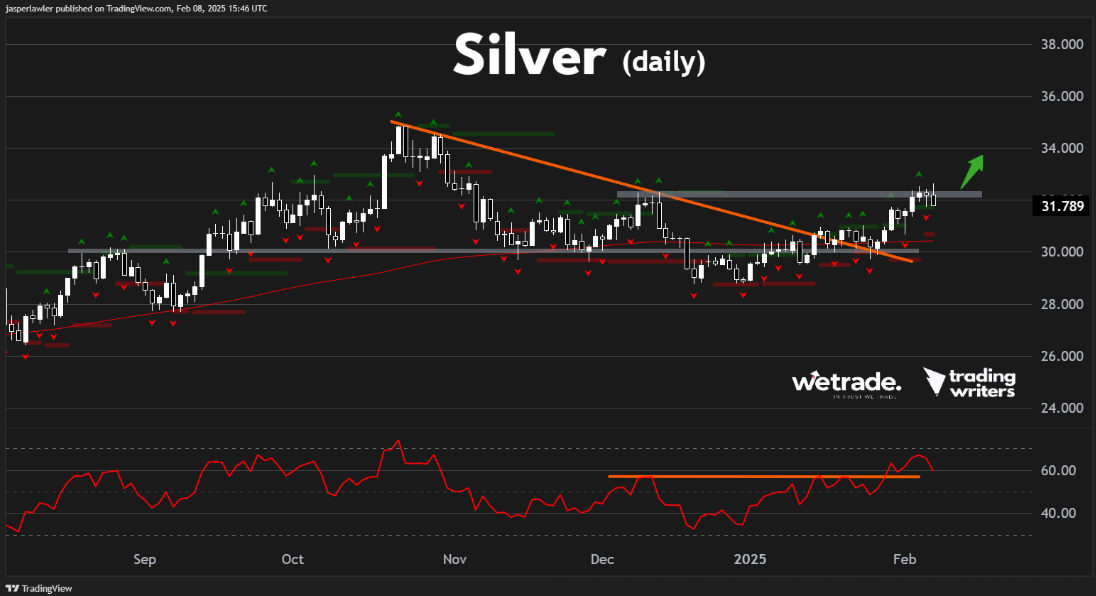
We are looking for a new fractal low to form or the breakout of a fractal high as a possible entry point to go long.
But - as always - that’s just how the team and I are seeing things, what do you think?
Share your ideas with us - OR - send us a request!
Send us an email or message us on social media.
Trade with WeTrade!
Every position closed is one step closer to unlocking WeTrade Honours privileges and redeeming exclusive rewards.
Start your trading journey here - Register now
Kickstart your trading of the week here - Login Now
Produced by Jasper and the Trading Writers team in collaboration with WeTrade