To effectively trade any strategy, you need to know what to expect when you place the trade.
1. Do you expect the trade to work straight away? Or will you have to wait?
2. How long will you wait before you cancel your order or exit your trade before it reaches its targets?
3. Do you expect the first trade to turn a profit, or is it usually your second or third attempt that works out?
4. How many attempts will you make before you give up, or even take the opposite position?
There are many more such questions you should already know the answer to before you place your trade. That way, you don’t need to make any crazy decisions under pressure when the trade is open.
USD/CAD has been a prime example of the point 3 above- and could soon be an example of point 4.
USD/CAD
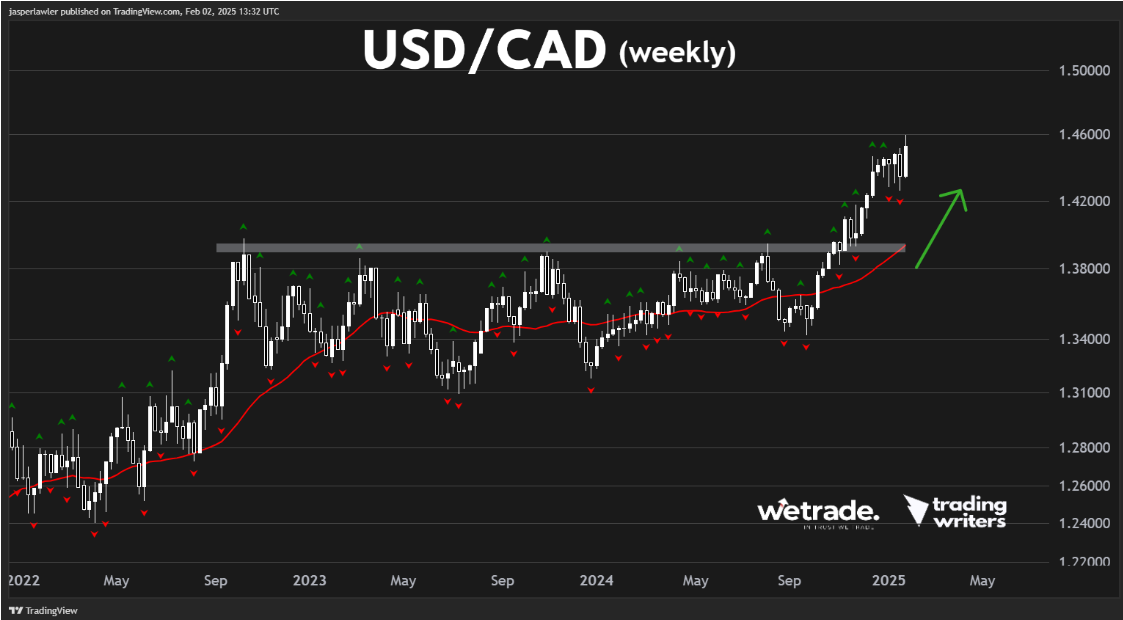
The long term environment for USD/CAD still looks very bullish to us. But that doesn’t mean every bullish trade setup will be easy.
The price is now well above the breakout of its long term trading range at 1.40 with the price up 600 points from there, testing 1.46 last week. The 30-week moving average is way back down at the breakout zone.
So it wouldn’t be a surprise for some trend exhaustion to cause the price to pull back further.
But it has already had a rest, trading sideways for the past five weeks. And our assumption is that it is enough for the trend to carry on - that’s why we’ve been trading the breakout.
The trouble has been - like is quite often the case - a false breakout.
The week before last, USD/CAD closed the day above short term resistance at 1.4465 only to see the price drop below the bottom of the range with a bearish engulfing candlestick pattern the very next day. The next day it made another intraday breakout, before reversing and closing the day flat.
So there was one and possibly two false breakouts, which if traded with a tight stop loss, would result in two losing trades.
Now the price has broken out again, only this time it closed the week above resistance.
Imagine taking the two losses and then missing out on the profit if/when the breakout finally works! Imagine taking another loss and missing out on the successful fourth attempt?
Equally, re-entering a trade can be difficult emotionally after taking a loss or two.
These are the kinds of scenarios you need to be ready for, before you enter the trade.
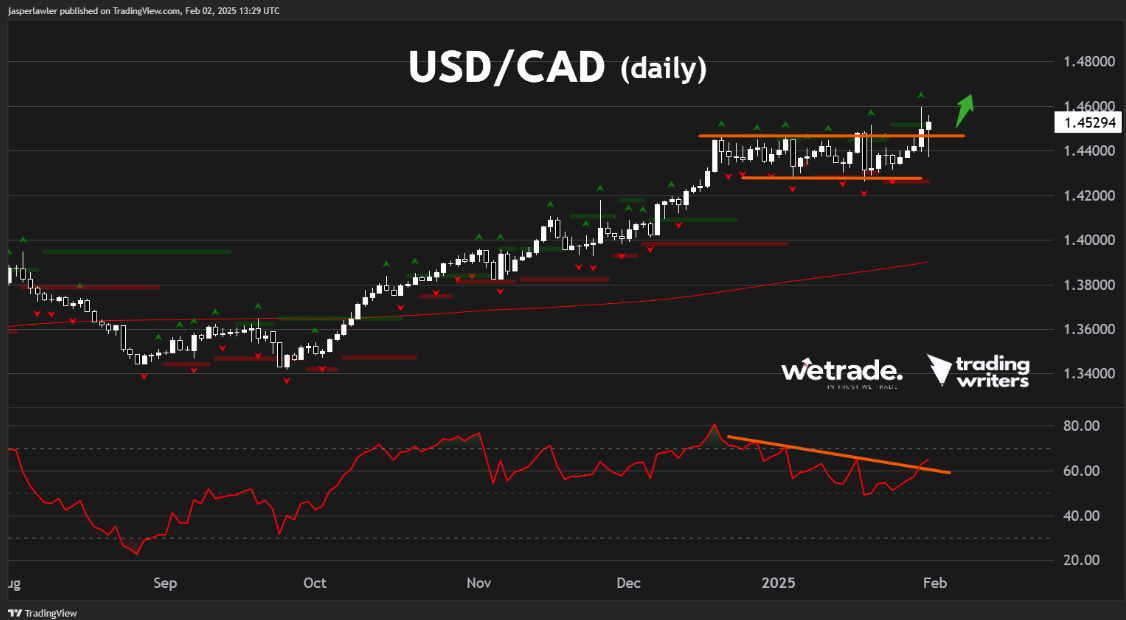
It could prove to be another ‘fakeout’ but the good thing is that this defines our risk. If the price moves back under the breakout level (1.4465) again, it no longer makes sense to be long.
While above the breakout level, the trend is your friend!
NZD/JPY
The kiwi-yen might not be on your radar, but we think it’s worth a look.
87.00 is major support on the weekly chart.
The support has held so far, but we think the price holding beneath its 30-week moving average suggests the bias should remain bearish.
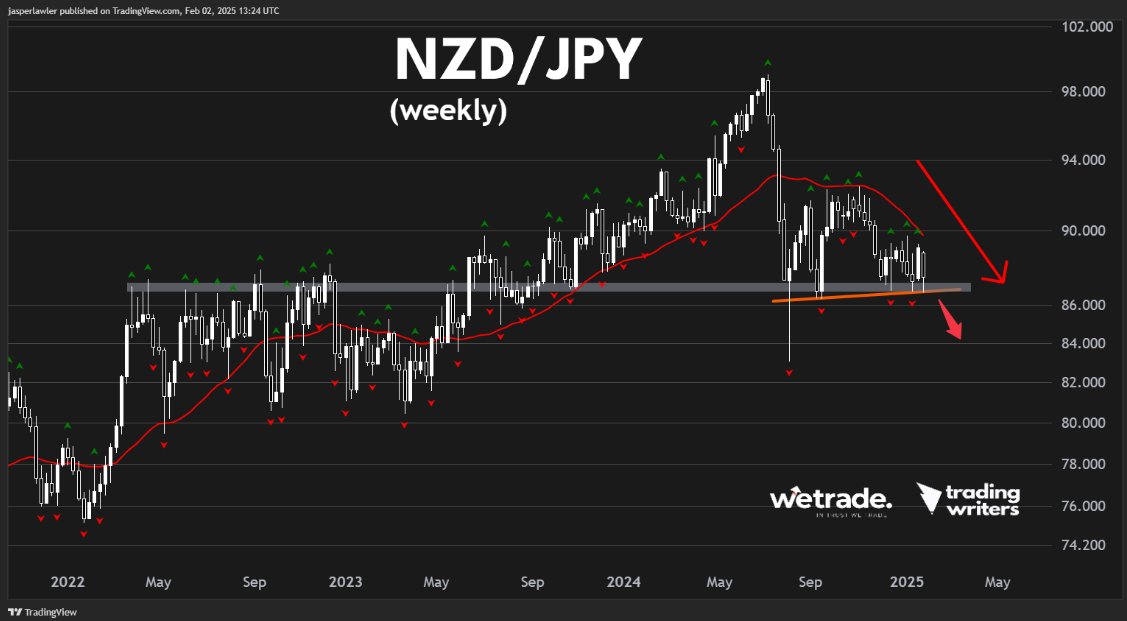
Another rebound to 89.00 could present another sell opportunity.
But we see a breakdown below 87.00 support as the higher probability trade to see more immediate action. As such we will look to be short while under 87, but neutral while above.
Gold (XAU/USD)
Gold is back trading at a new all time high.
That follows the breakout of the triangle pattern we pointed out back in week 53.
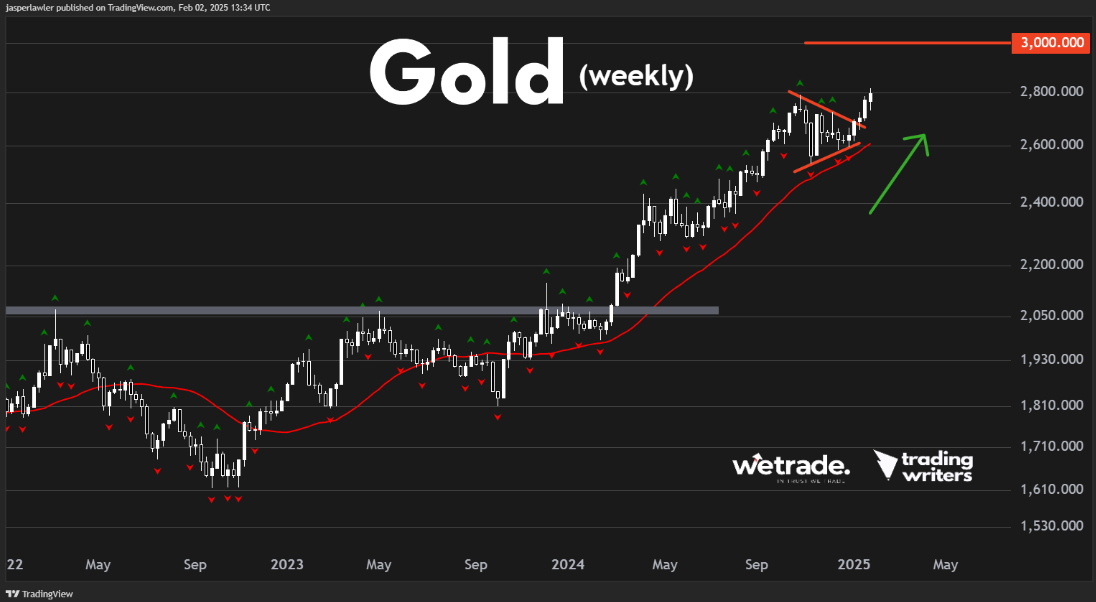
We’ve been trading the breakout above upper fractals since the setup mentioned back then in week 53.
New record highs are always bullish and we will be looking for long trade setups above 2,800.
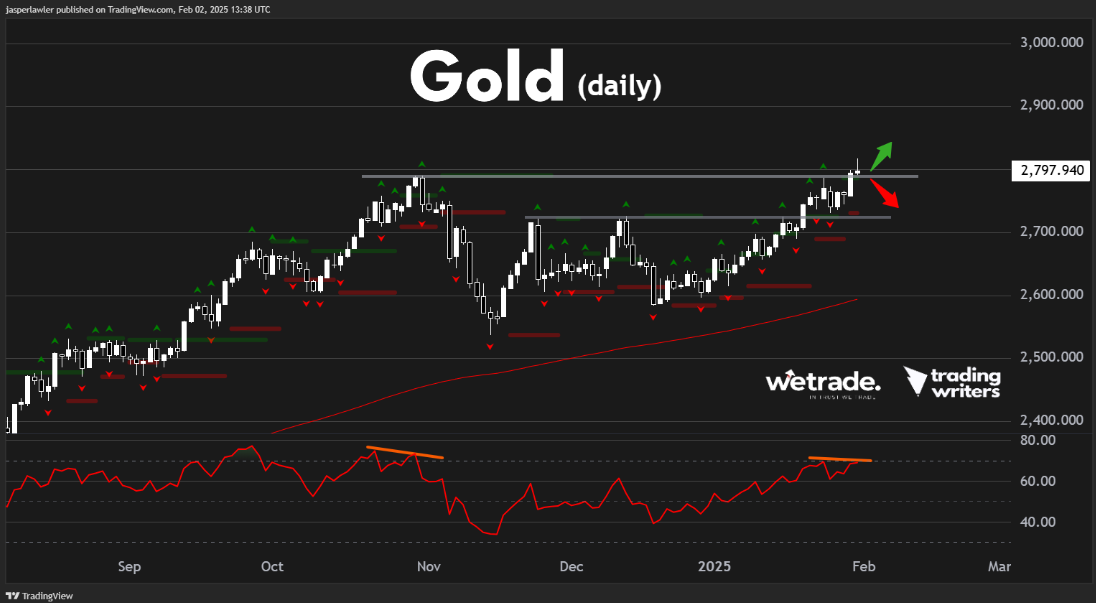
But of course there could be a false break - and we are watching a possible bearish RSI divergence to confirm a short term top.
But - as always - that’s just how the team and I are seeing things, what do you think?
Share your ideas with us - OR - send us a request!
Send us an email or message us on social media.
Trade with WeTrade!
Every position closed is one step closer to unlocking WeTrade Honours privileges and redeeming exclusive rewards.
Start your trading journey here - Register now
Kickstart your trading of the week here - Login Now
Produced by Jasper and the Trading Writers team in collaboration with WeTrade