(GBP/USD | EUR/GBP | UK100)
Perhaps it’s a coincidence or perhaps not - but the major markets of Great Britain - meaning the British pound vs the dollar (GBP/USD) and the euro (EUR/GBP) as well as the benchmark UK stock index (FTSE 100) are at inflection points.
There was just an election in the UK in which the country kicked the Conservative Party out of power after 14 years in government. Naturally there might be some changes to policy that affect the country’s main markets.
Or perhaps politics has nothing to do with it - in the end we don’t really care! Because our analysis assumes all the known information is already being reflected in prices.
GBP/USD
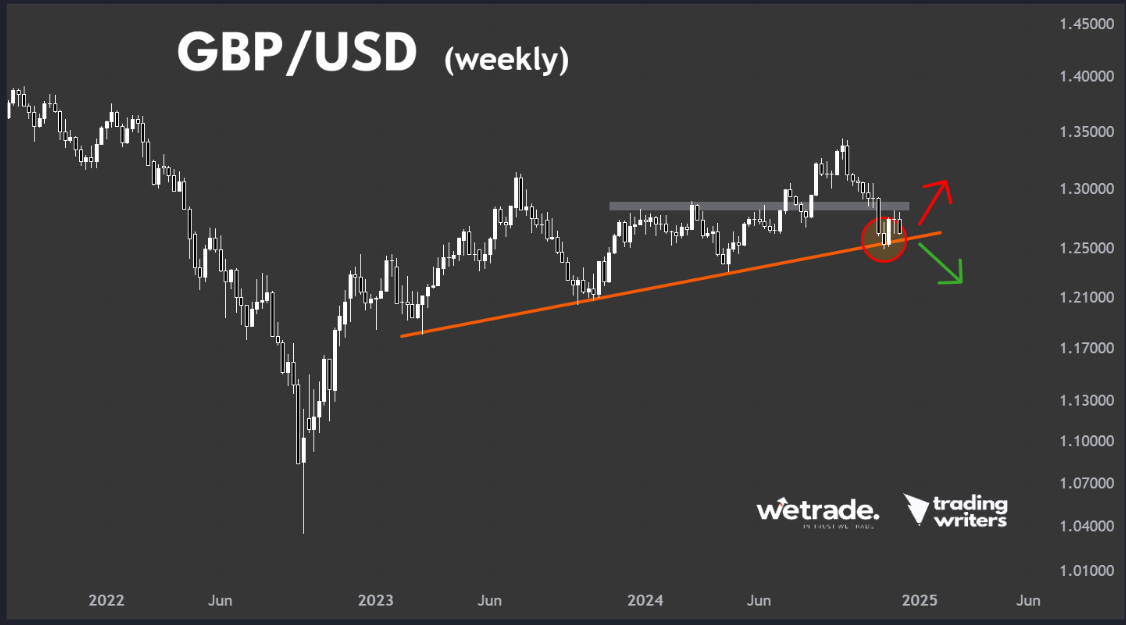
We mentioned this long term uptrend line in week 48’s analysis. There has been some bounce off the line so anybody who traded the line as support should have done alright.
However, we didn’t advocate for this but we said “any bullish rebound would offer a chance to rejoin the new long term downtrend.”
The basis for our bearish view was (and is still) that there was a monthly close below this long term uptrend line.
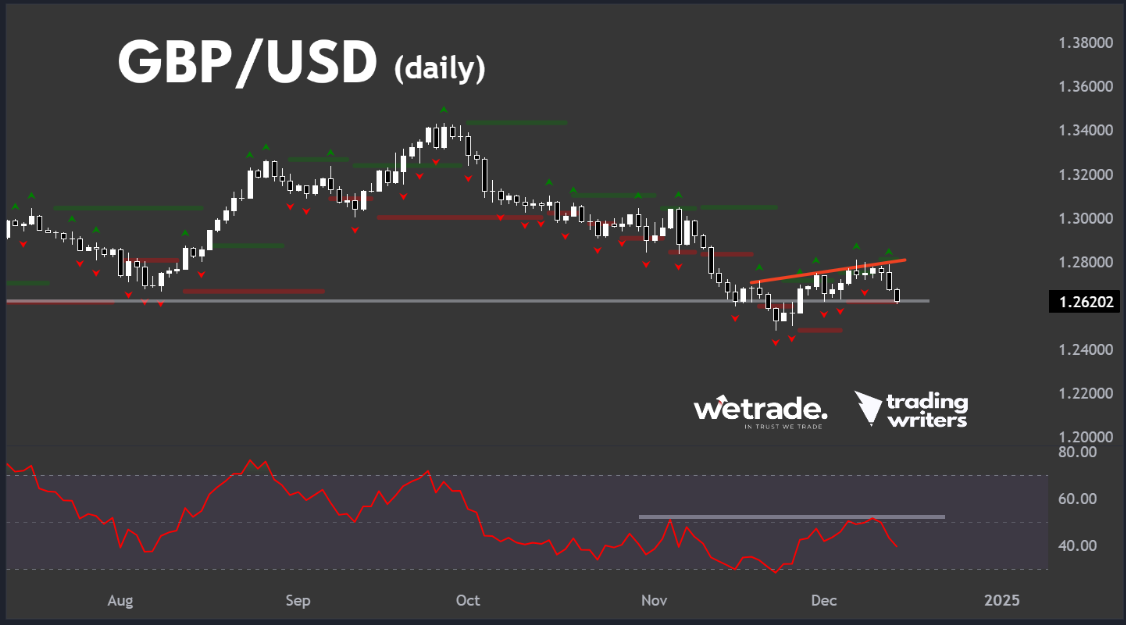
Looking at the daily chart, GBP/USD has started to roll over having failed to make any significant break to the upside.
We are watching the 50-level on the 14-day RSI as resistance. A move over this level could act as confirmation that GBP/USD has bottomed at the long term trendline. But for now, it is resistance and it seems our previous analysis that the long term trendline has broken and price will continue lower is the most probable outcome.
We will be looking for further clarification that GBP/USD is breaking down from its consolidation above the long term rising trendline - this would most likely be via a break below a second lower fractal.
EUR/GBP
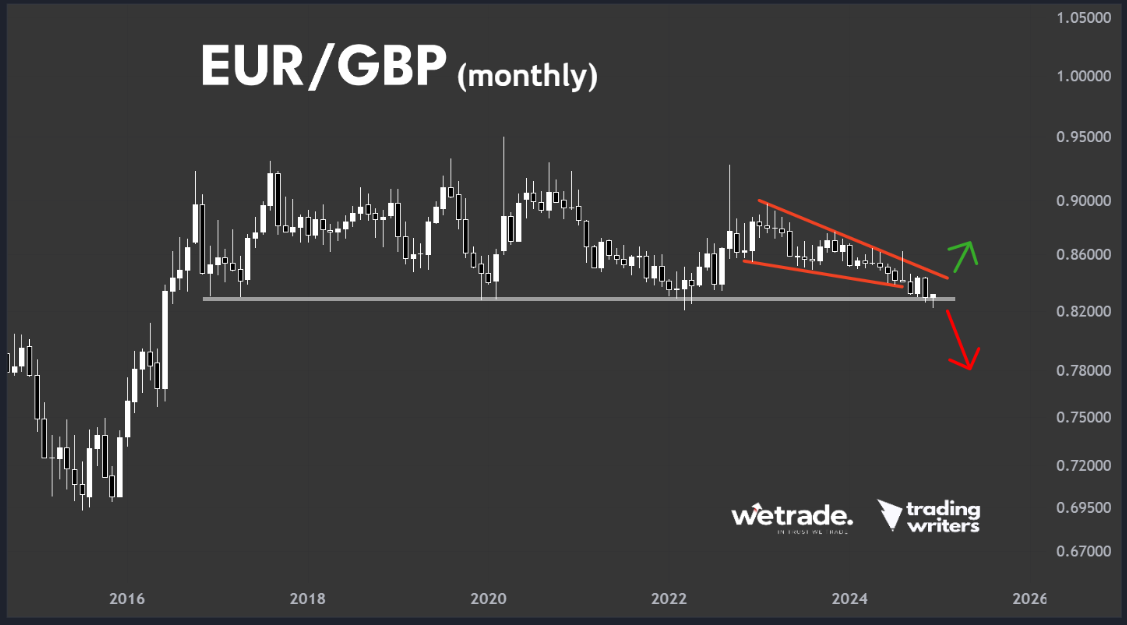
You know the level of support or resistance is long term when you need to zoom out to the monthly chart to see it properly.
I’d add to this - that you can only know it has broken with a monthly close below support (or above resistance).
You can see that so far, December’s monthly candlestick dropped into the support but has rebounded back to near where it opened. Of course, the month has not finished yet - so we need to wait for the close of the monthly candle.
A monthly close under this level, and I can see some huge downside coming in the following weeks. However, a close higher (which would be in line with GBP/USD breaking lower) would see a chance to return back into the long term trading range - possibly back up to the highs above 0.90.
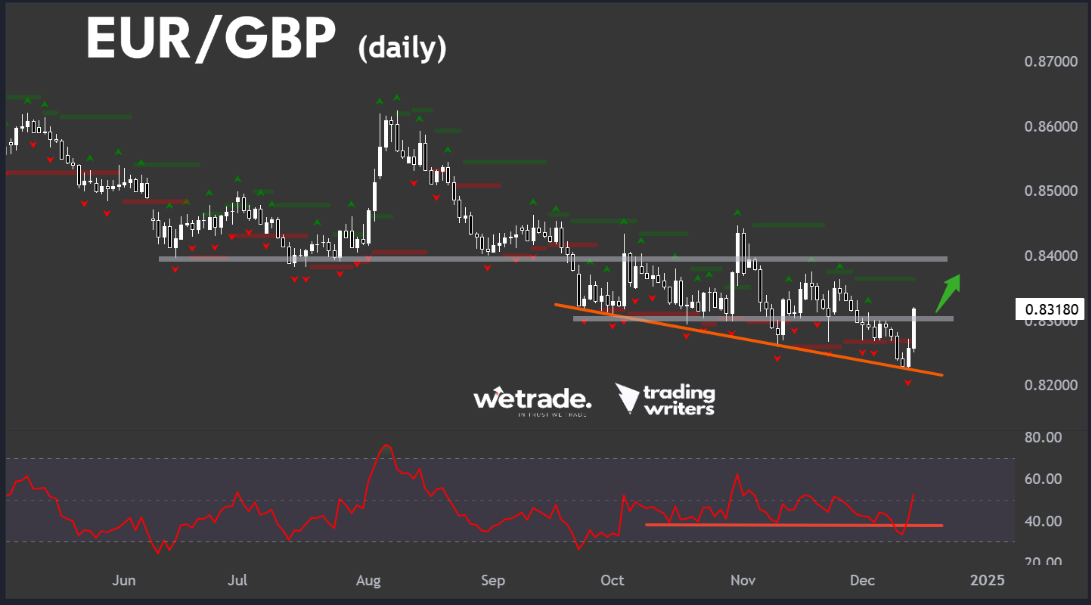
The EUR/GBP daily chart shows a downtrend is still intact BUT it has weak momentum.
Do you see how each new low has been supported by a down trendline? - i.e. the downtrend has not been accelerating. Almost as if the euro is incrementally being accumulated as it goes lower.
You can see that the 14-day RSI has not reached oversold territory since September when it dropped to the 0.83 level. Oversold conditions is something we’d expect to see if there was a strong downtrend.
We see 0.8300 as the line in the sand for trading a rebound off the long term support - while the price is above here we are bullish. Added confirmation would come with a close over 0.8400.
However, while under 0.83 we’ll assume our view is wrong (for now) and that the downtrend is still going.
UK100 (100GBP)
To complete our trifecta of British markets, let’s look at the UK 100 index, which you can find on the WeTrade MT4/5 platform as 100GBP.
There is an imperfect intermarket correlation between GBP and 100GBP. Quite often, as the pound trades lower - the average on the 100 largest UK stocks trades higher.
There are lots of explanations for this but the main one being that there are a lot of multinational companies listed on the FTSE 100 index that have large foreign earnings. These foreign earnings increase when converted into cheaper pounds.
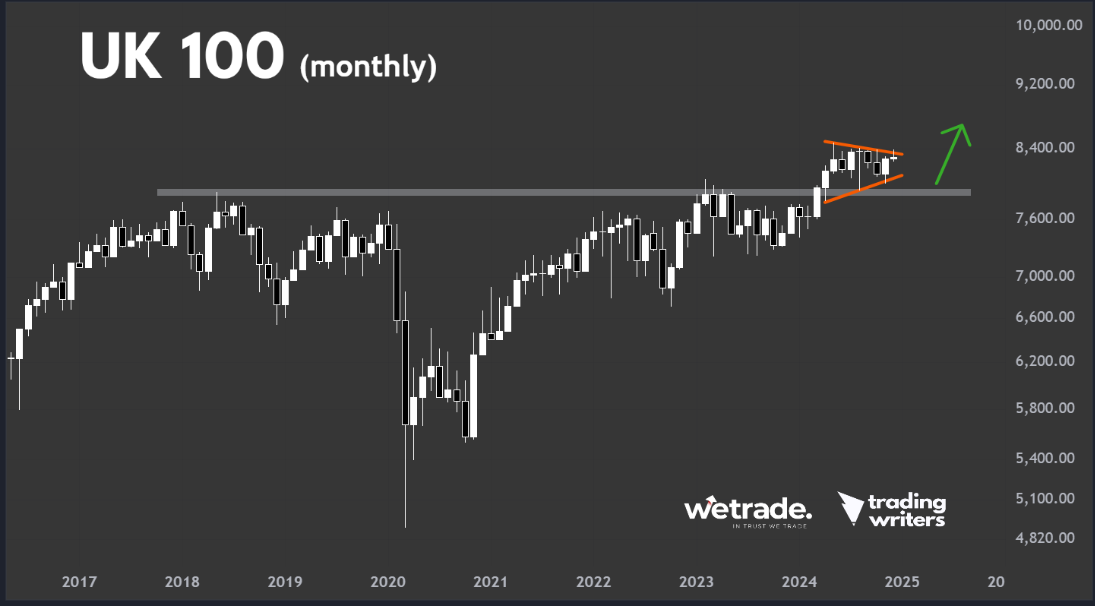
On the monthly chart we see that resistance at 7700 has been broken. We want to be long term bullish while above this level.
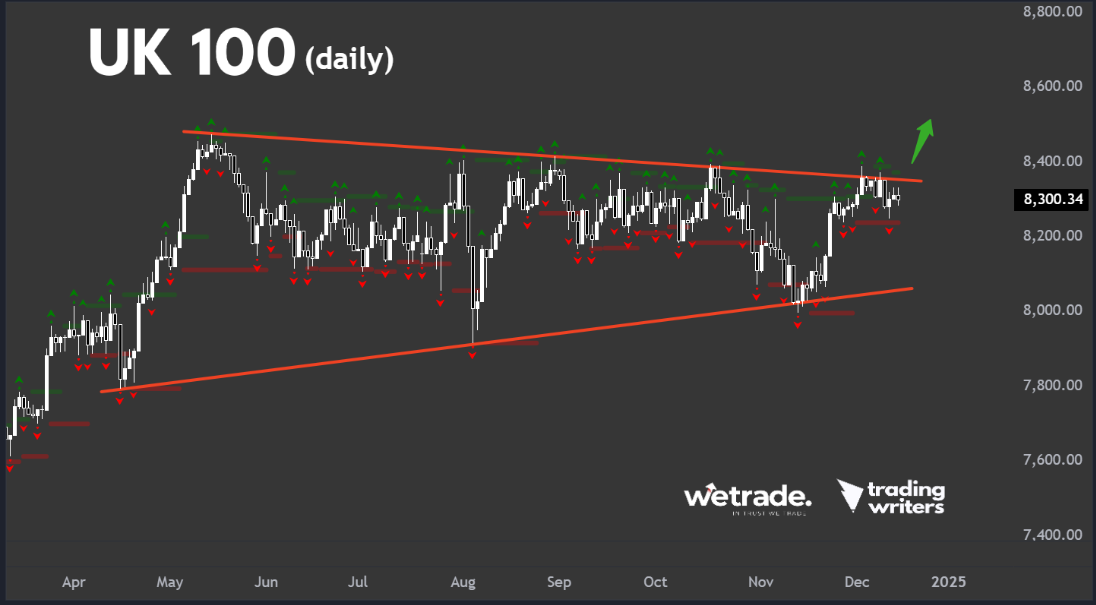
On the daily chart, we see that price has traded in a big triangle pattern for the second half of 2024.
We are waiting for the bullish breakout of this triangle to confirm our long term bullish view is playing out in the short term too.
But that’s just how the team and I are seeing things, what do you think?
Send us a message and let us know how you plan to trade these markets.
Trade with WeTrade!
Every position closed is one step closer to unlocking WeTrade Honours privileges and redeeming exclusive rewards.
Start your trading journey here - Register now
Kickstart your trading of the week here - Login Now
Produced by Jasper and the Trading Writers team in collaboration with WeTrade.


