(EUR/USD | EUR/JPY | Silver)
EUR/USD
There is something just beautiful about a well defined price range.
We focus on trading in trends - but somehow ranges just look better.
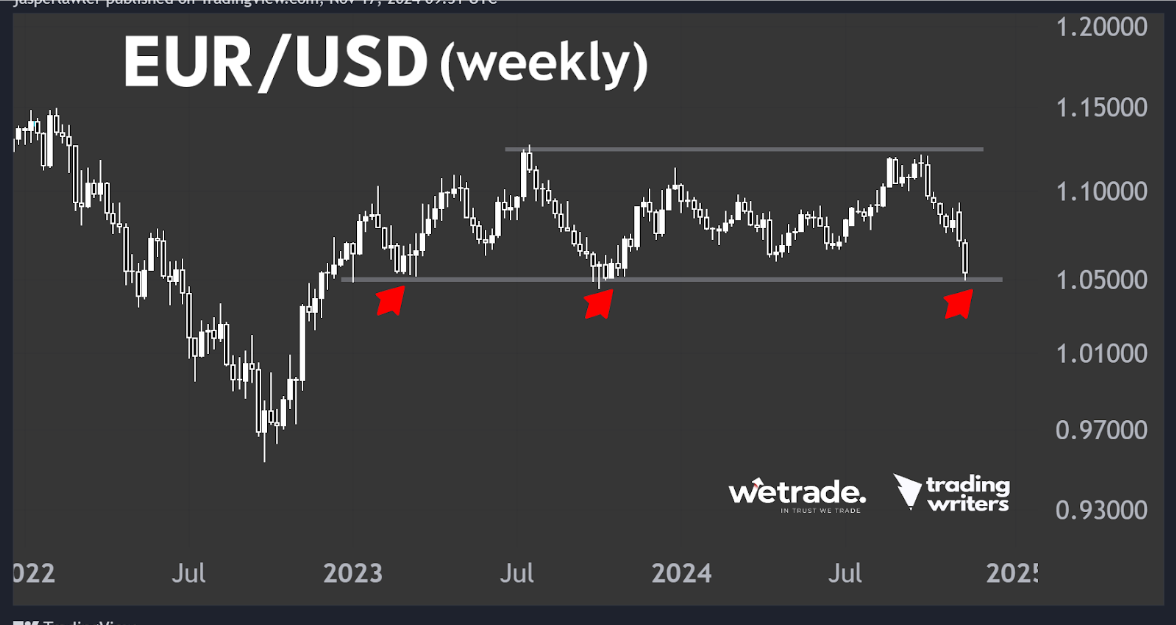
1.05 is a big level in EUR/USD - it’s been support for the best part of 2 years. Should the support break, the euro could fall off a cliff!
So back to trading 101 - we first try to buy at support, and if it breaks - we look to sell. The idea is to assume the range will continue, until it doesn’t. We do the same with trends actually.
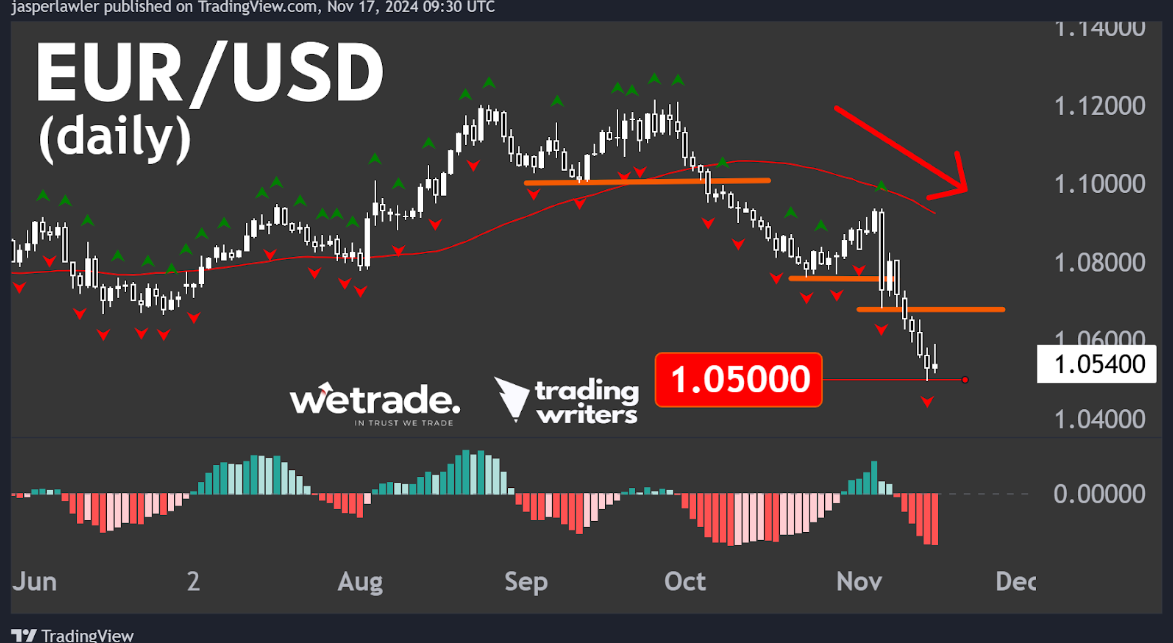
Dropping down to the daily chart, EUR/USD is in a clear downtrend.
As a reminder ‘not trading’ is a position - just like buying or selling.
Because if the daily trend is down, we want to sell - but if we’ve just hit weekly chart support - we want to buy. The two time frames are conflicting, which is not a high probability setup.
We don’t know what will happen to this long term (weekly) support level - it could hold or break. But we don’t need to - we can wait to see which one happens and trade it.
A weekly close below 1.05 would confirm that the long term trend has turned down in the euro. However, a bullish reversal pattern and a break above a higher fractal on the daily chart would suggest the level has held.
EUR/JPY
The theme of euro weakness continues in this forex cross.
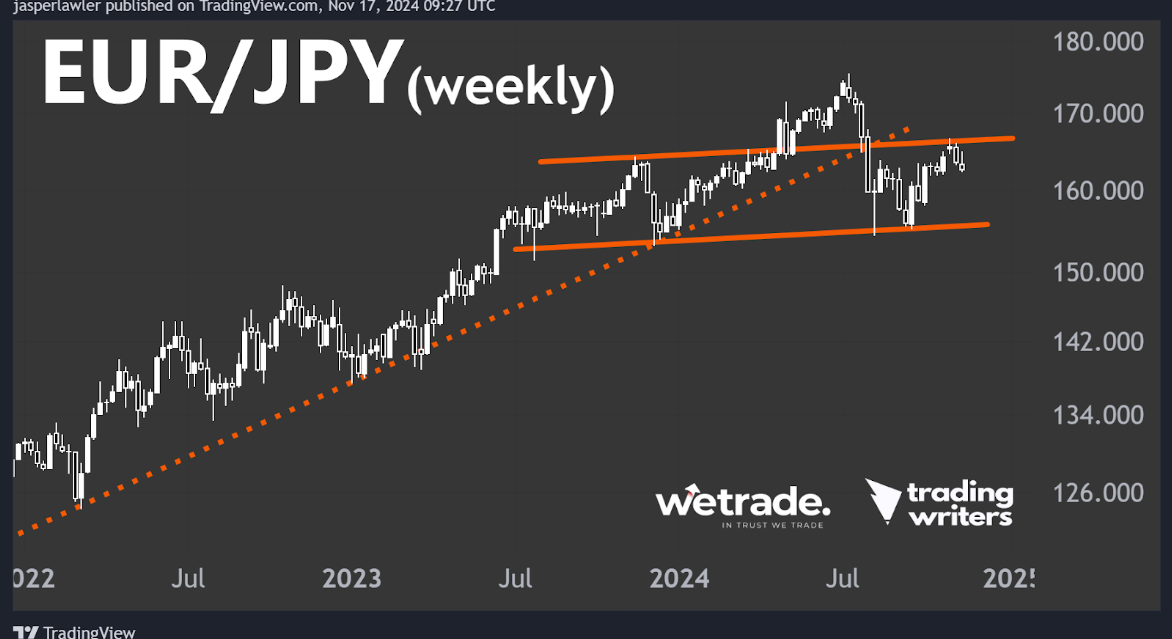
We first suggested the possibility of a long term head and shoulders pattern for EUR/JPY in week 41’s analysis.
6 weeks later.. And it looks like we might have been onto something.
The price has now pulled back for 2 weeks from what could be the ‘right shoulder’ - forming a higher fractal on the weekly chart.
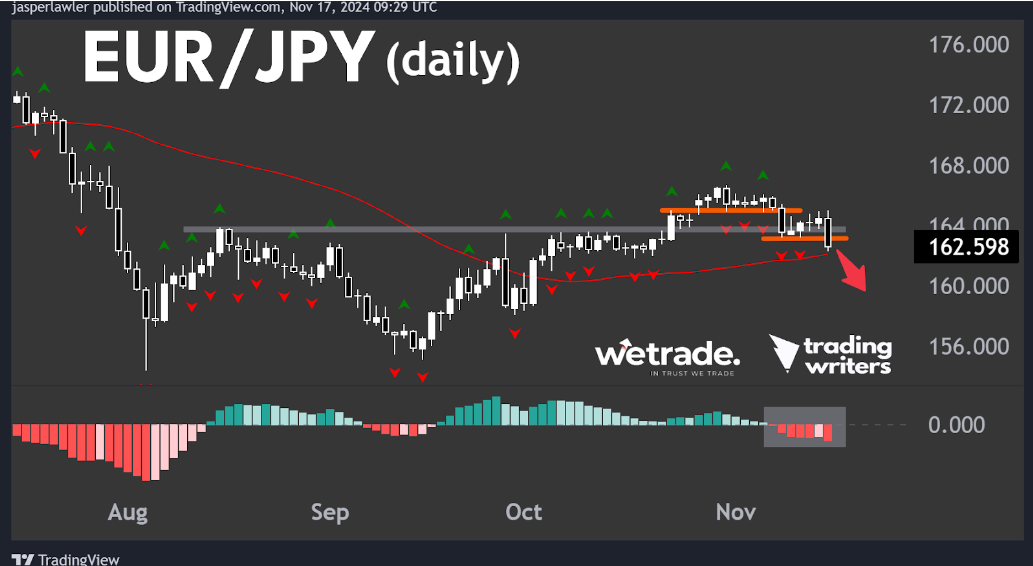
On the daily chart, the price just closed back below resistance-turned support at 164. That’s a false breakout of the resistance - which often leads to lower prices.
We also just saw the second break of a lower fractal - suggesting a trend reversal. Added to that, the MACD histogram has been holding below the zero line.
For now, the 50 SMA is providing some support. Any rebound should find resistance from Friday’s high if this breakdown is really happening.
Silver (XAG/USD)
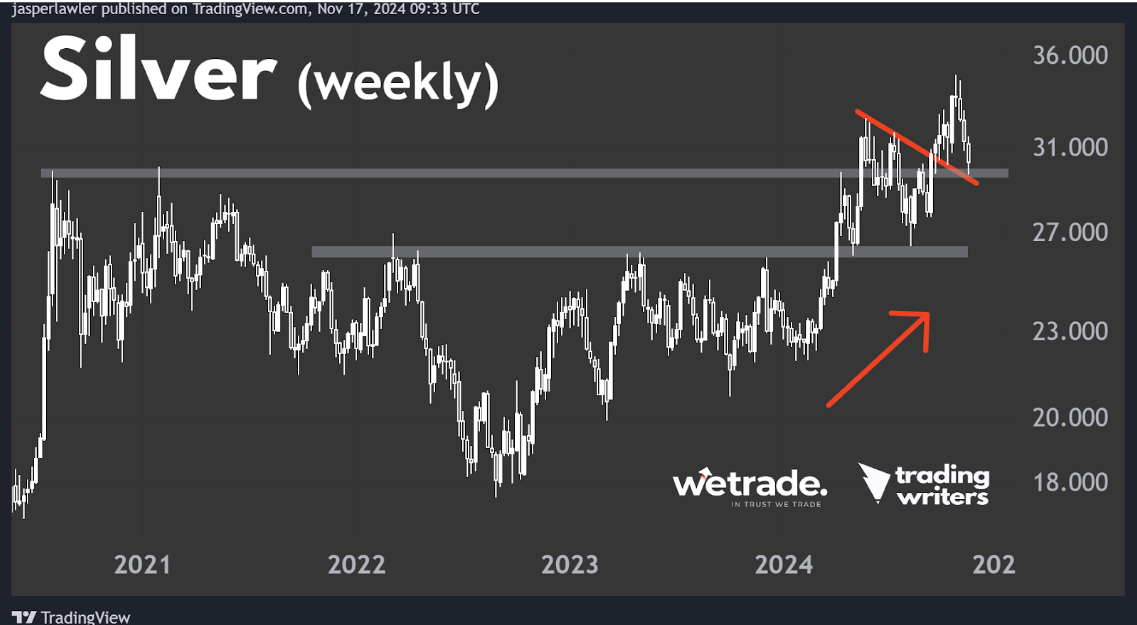
There is a 3X confluence of support for silver
-
-
-
- 1. The $30 round number
- 2. Multi-year resistance
- 3. Re-test of broken downtrend line
-
-
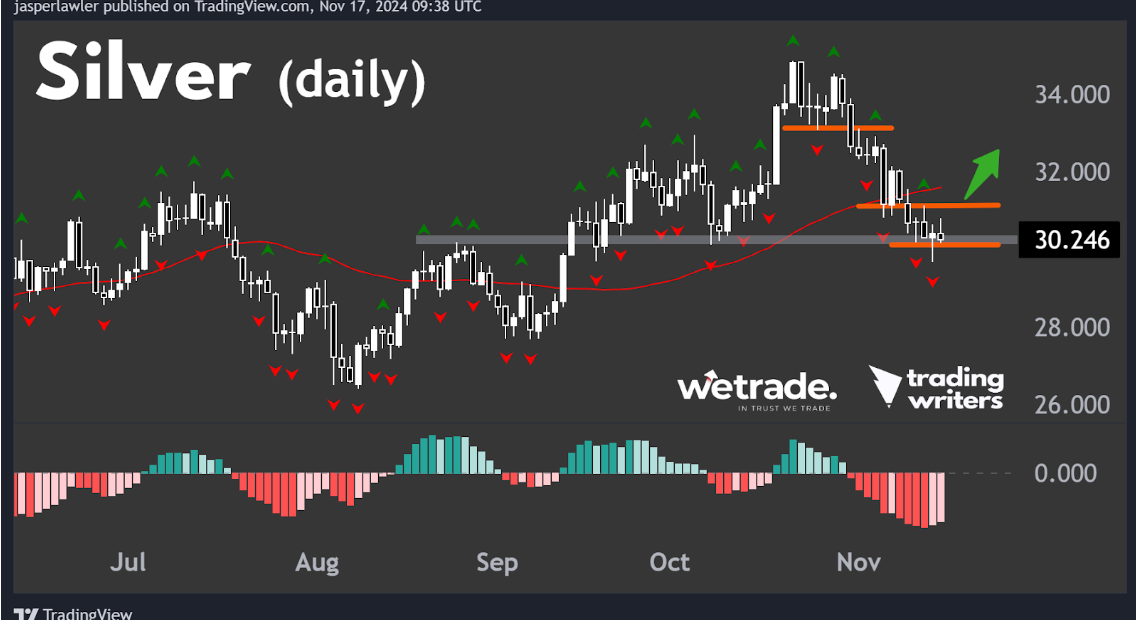
As such, we are looking for confirmation that this support will hold and that the bull market resumes - i.e. we’re looking to see if we can ‘buy the dip’.
There are some initial signs that the 3-week downtrend is ending - but there is not quite enough evidence yet.
There was a bullish hammer candlestick pattern and the MACD histogram has started moving higher.
A break above the last higher fractal as well as the 50 SMA would be some extra evidence to indicate silver is ready to take off again.
But that’s just how the team and I are seeing things, what do you think?
Send us a message and let us know how you plan to trade these markets.
Trade with WeTrade!
Every position closed is one step closer to unlocking WeTrade Honours privileges and redeeming exclusive rewards.
Start your trading journey here - Register now
Kickstart your trading of the week here - Login Now
Produced by Jasper and the Trading Writers team in collaboration with WeTrade


