(Ethereum | Nasdaq | USD/CAD)
Ethereum
Some of our favourite types of trades are known as ‘catch up trades’.
One of the stand-out ‘Trump trades’ since the US presidential election has been Bitcoin hitting record highs.
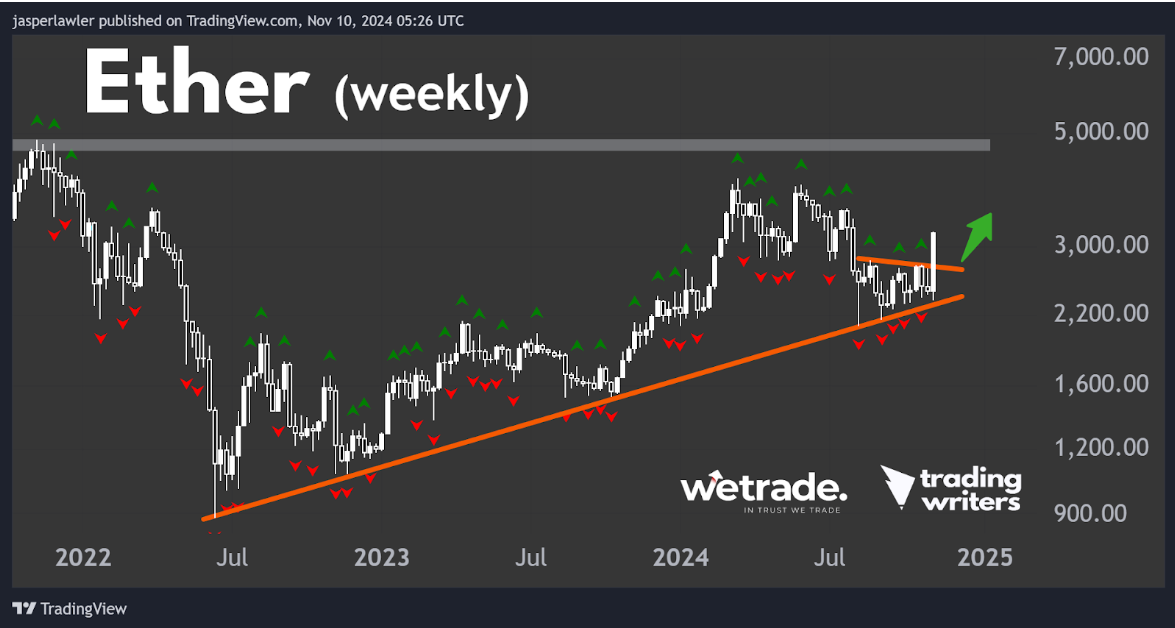
We suspect Ethereum token ‘Ether’ is next - i.e. it’s about to catch-UP.
The price has just broken out above a triangle pattern after having held above a long term trendline that started in mid-2022. It’s also taken out the $3000 round number.
The ultimate confirmation of strength is if/when Ether makes all-time highs (like Bitcoin). But there could be opportunities to join the short-term uptrend until that happens.
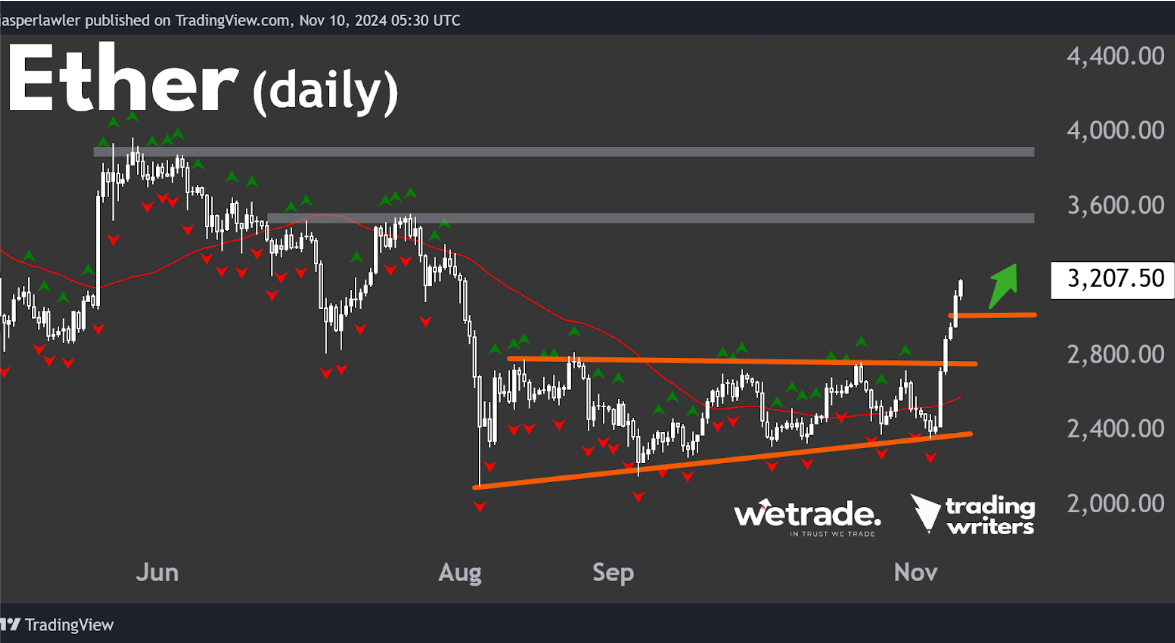
The triangle breakout is all-the-more clear on the daily chart.
The triangle resistance at 2800 is now support - but given the strength of the breakout - it seems unlikely the price will get back there. The $3k level could hold the price on any dips.
Upside targets come in just shy of $3600 and $4000 according to the July and May highs respectively.
Nasdaq (NASUSD)
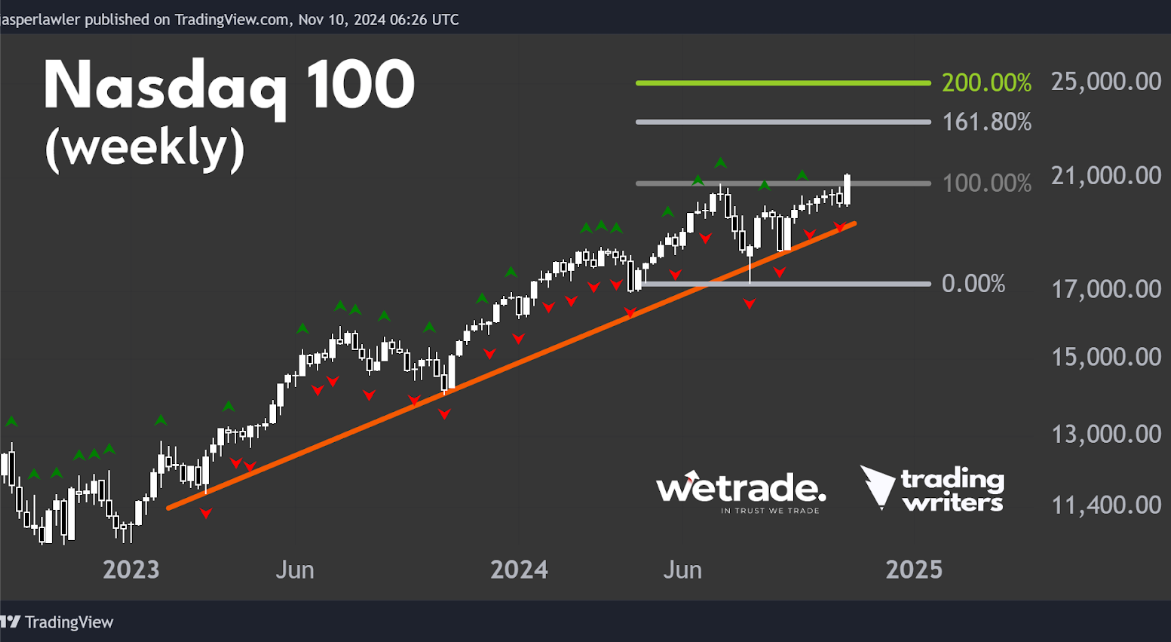
The Nasdaq has finally broken out to a record high after weeks of small-range candlesticks.
The breakout matches the record highs in the other main US benchmarks (S&P 500, Dow).
New record highs don’t tend to happen in bear markets, they happen in bull markets - and in bull markets we generally want to be buying.
Then there’s the matter of timing.
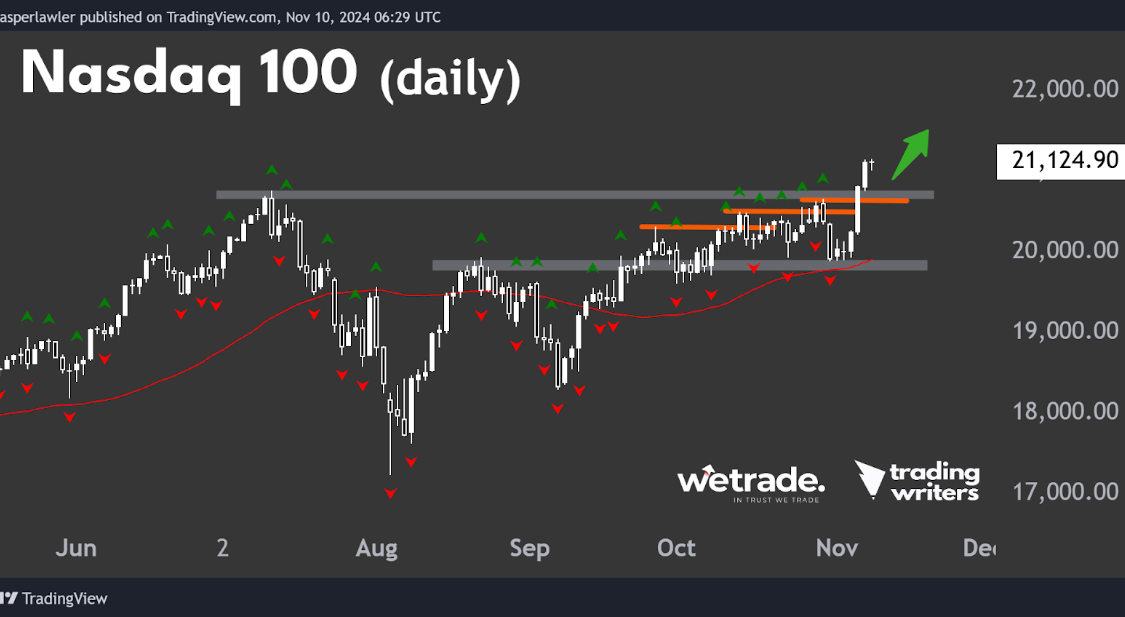
On the daily chart, we can see how price was forming higher highs while holding above the 50 DMA prior to the breakout.
Former resistance at 20,750 is now support.
Resistance comes in at 22,000 then the 161.8% Fibonacci extension at 23,200.
USD/CAD
For forex traders, the clear trend going into the election was USD strength.
That has been clearest in USD/JPY and EUR/USD but we’re looking instead at USD/CAD.
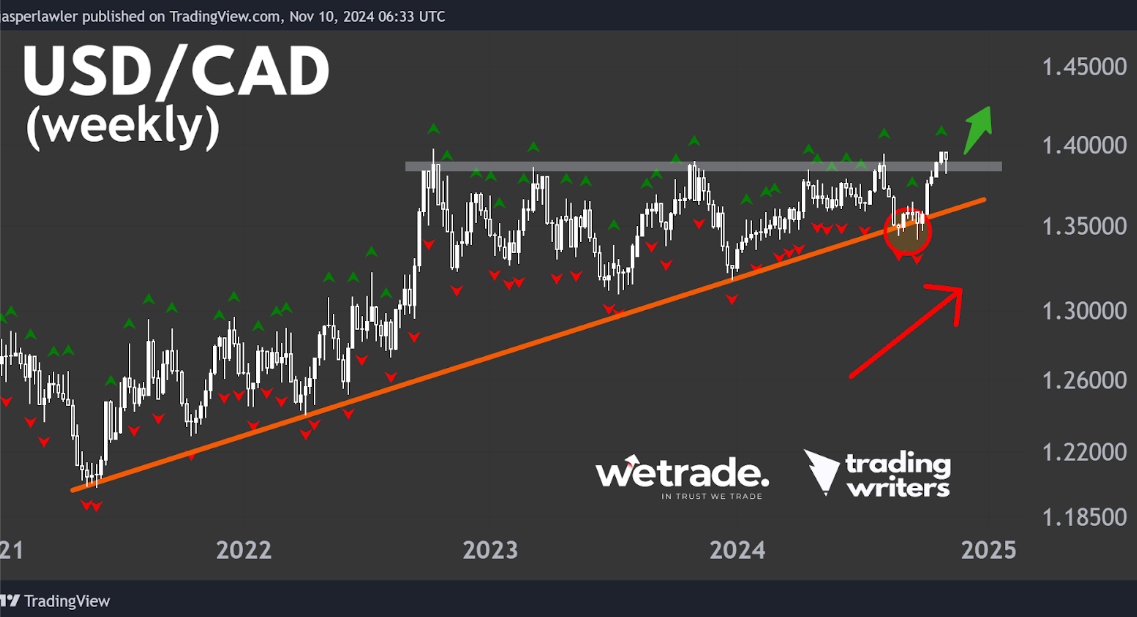
1.40 has been major resistance on this weekly chart going back two years.
There has not even been an intraday move over 1.40 since May 2020 (over 4 years ago). There has also not been a weekly close above 1.39 for 4 years - until the week before last.
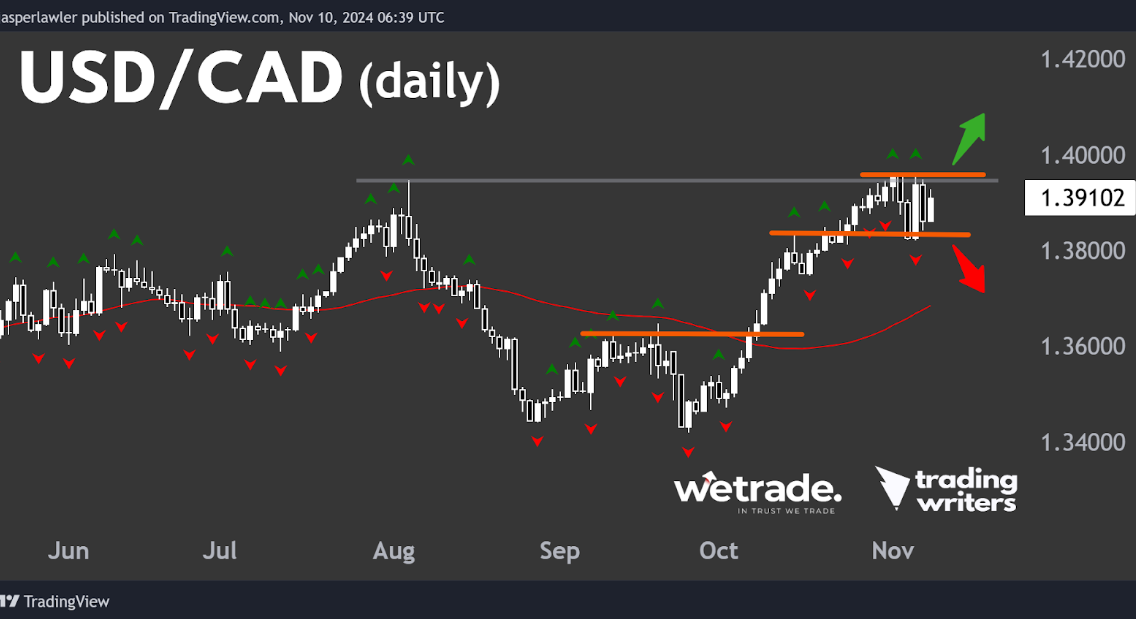
Last week the price pulled back, tested the resistance-turned-support and it held.
Given the importance of this price level, it’s not surprising to see some choppy action on the daily timeframe.
The two short term scenarios are a break above last week’s high and confirmation of the long term breakout in USD/CAD or a larger pullback from resistance. Should the pullback occur, we’d be waiting for the next lower fractal to form before thinking again about long positions.
But that’s just what we think, how are you seeing things?
Send us a message and let us know.
Trade with WeTrade!
Every position closed is one step closer to unlocking WeTrade Honours privileges and redeeming exclusive rewards.
Start your trading journey here - Register now
Kickstart your trading of the week here - Login Now
Produced by Jasper and the Trading Writers team in collaboration with WeTrade.


