(Bitcoin | GBP/USD | USD/JPY)
Bitcoin
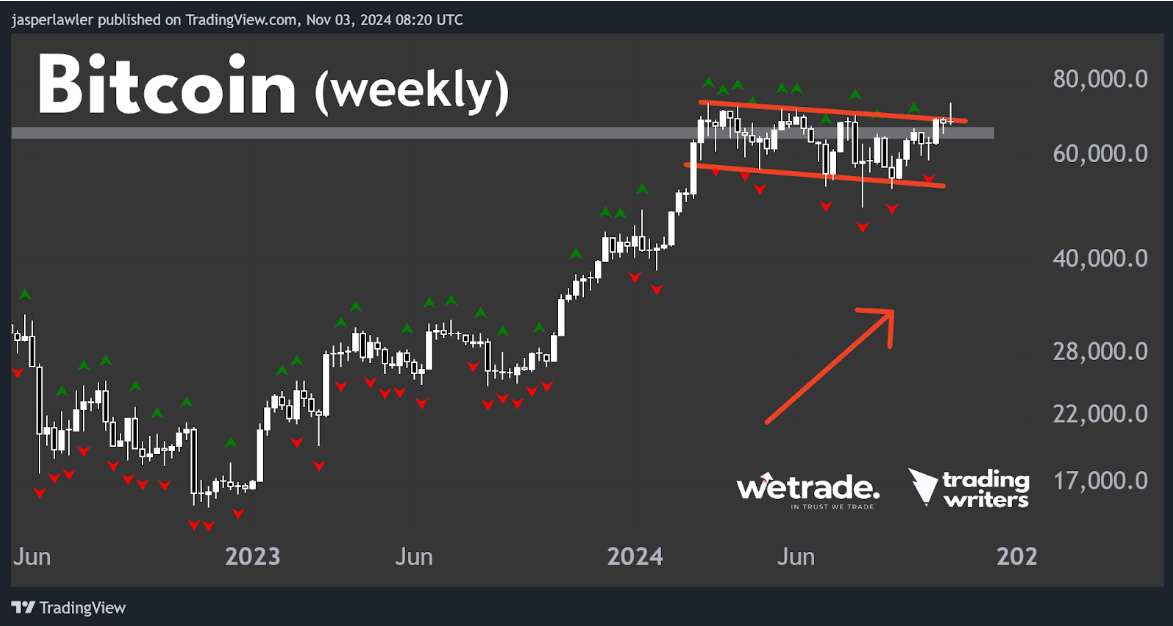
Possibly the most widely watched and acknowledged chart pattern in the markets right now is the bull flag pattern in Bitcoin.
Last week the price attempted an upside breakout but got rejected.
Those bought Bitcoin on the break above the upper trendline in the flag pattern are either flat or got stopped out.
That raises the question about how to enter a position to trade a flag pattern.
Option 1: Trade the breakout
Almost inevitably when trading breakouts, it takes more than one attempt to enter the trade because of false breakouts. Trading an intraday breakout will give you a better entry price, while waiting for a closing candle above the flag pattern adds confirmation but your entry price will be worse.
Trading only on a weekly close over the flag pattern in Bitcoin would have avoided last week’s fakeout.
Option 2: Trade at the bottom on the range
One of the basic rules of trading is NEVER go long under resistance. However, going long at support offers the chance of a high risk:reward ratio.
As such, in a flag pattern, an alternative is to enter a position above the lower trendline.
On that basis, the current Bitcoin price is under resistance so no trade within the range is possible unless there is another drop down to the lower trendline. But keep in mind, the longer the pattern lasts, the greater the chance it fails (i.e. price breaks lower from the bull flag).
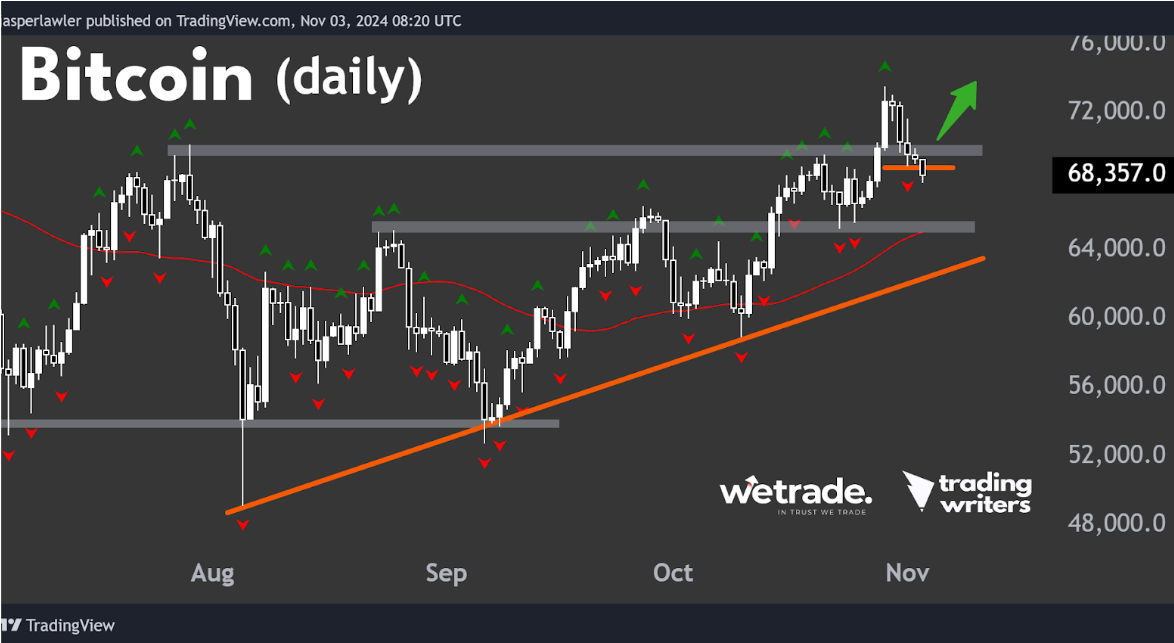
On the daily timeframe Bitcoin has broken below one lower fractal, meaning it is in a correction of its uptrend.
The next opportunities to go long will be when a new lower fractal forms or from the break above an upper fractal. If price continues to fall near term, we will keep our bullish bias while above the up trendline on the daily chart.
GBP/USD
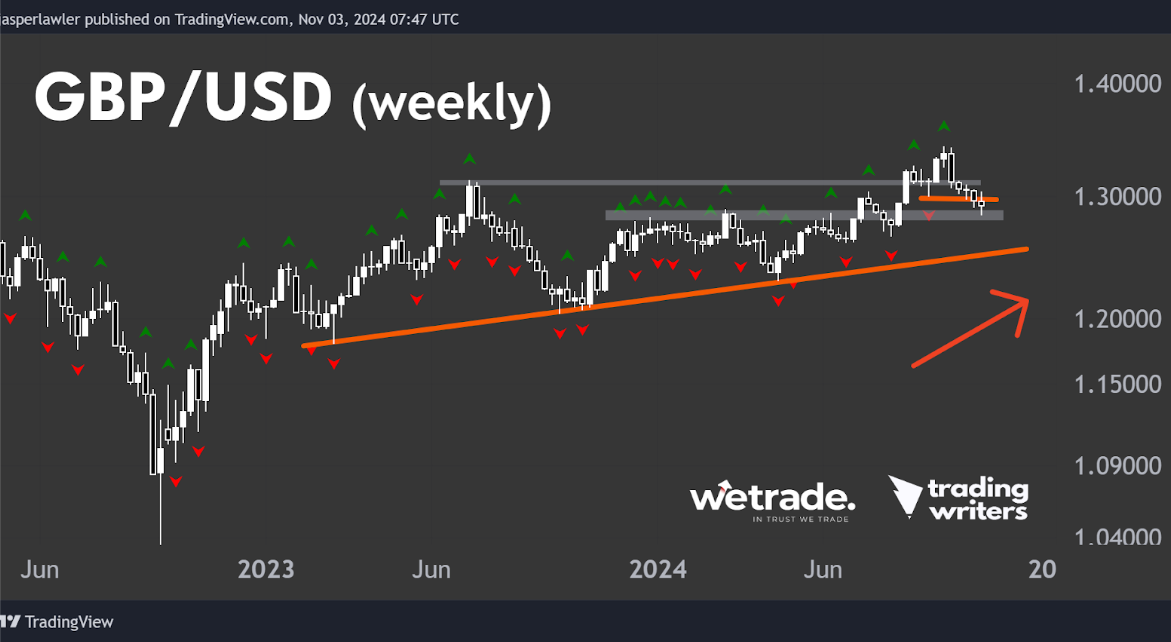
‘Cable’ has pulled back from a 1-year high with relatively low volatility as evidenced by the narrow range candlesticks in the weekly chart.
It is sitting just above resistance-turned support in the 1.28-29 zone.
The long term bias remains bullish while above the rising trendline.
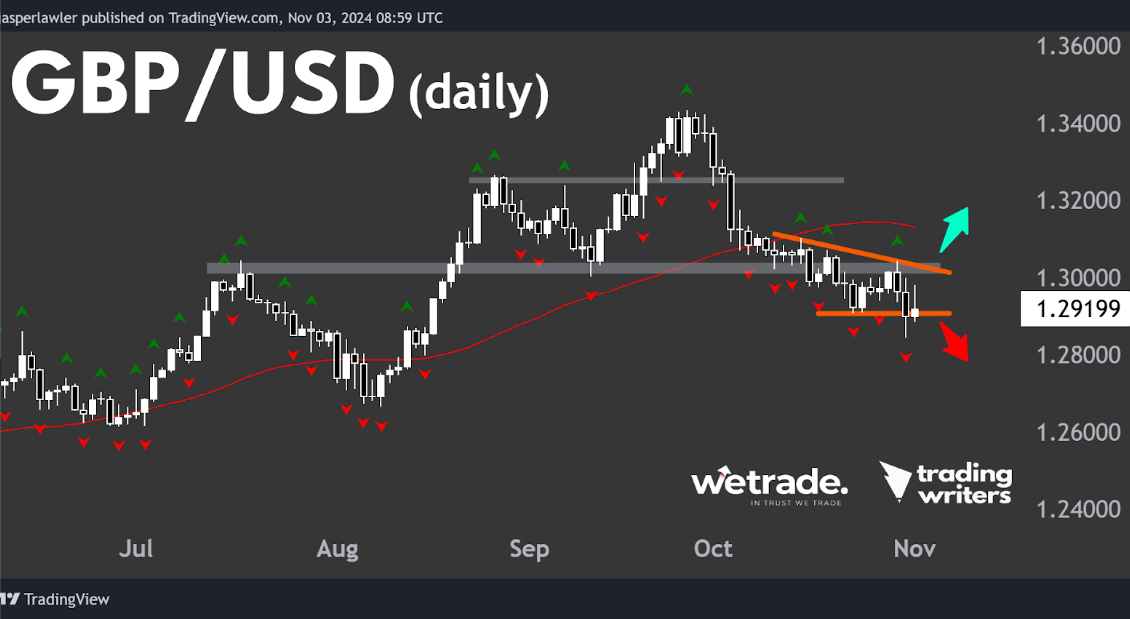
On the daily chart, price has dropped under the last lower fractal, signalling a continuation of the downtrend.
A break back over 1.30 and the last upper fractal would be needed to prove within reasonable doubt that the long term support zone has held and that the long term uptrend is about to resume.
USD/JPY
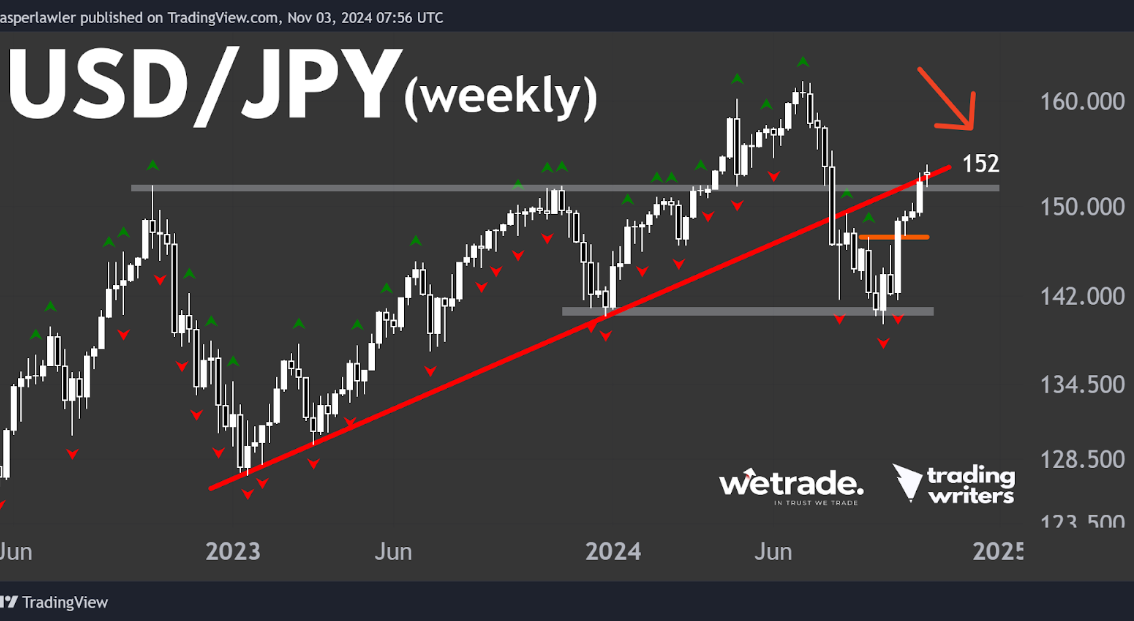
In week 43 we talked about how to fade an uptrend, using the example of USD/JPY.
As a quick refresher, the idea is that you can go short in a daily uptrend when it starts to show weakness at a big level on the weekly chart. And same idea for any combination of timeframes.
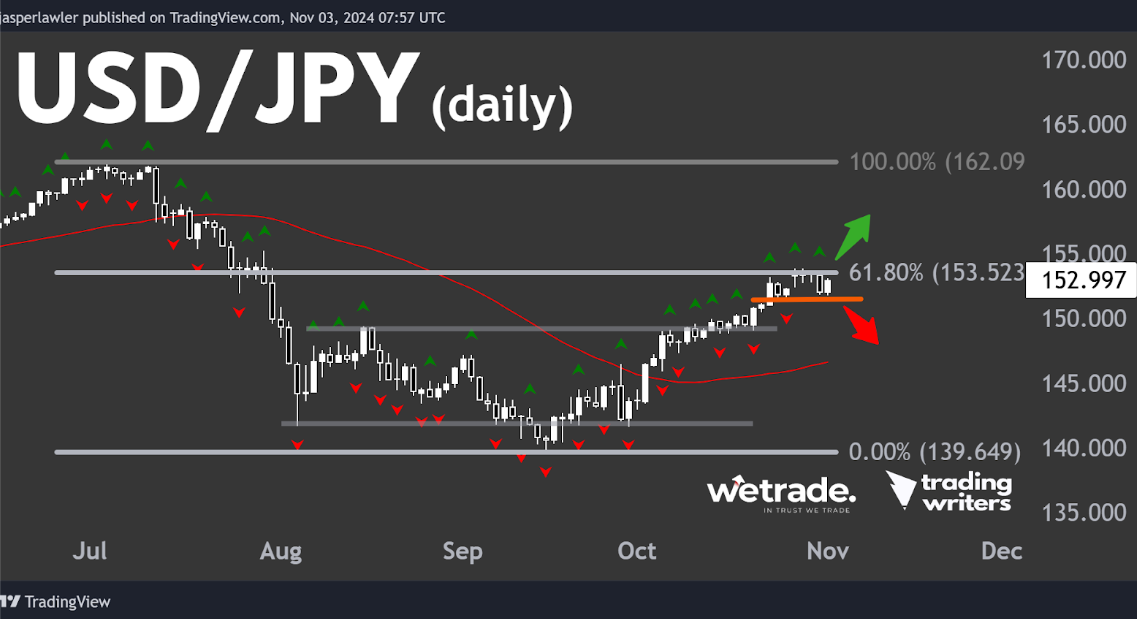
Well, now it's crunch time. The price has now risen to (and slightly above) our weekly resistance level at 152 & the broken uptrend line. So we are looking for opportunities to fade the daily trend.
On the daily chart the price has stalled at the 61.8% Fibonacci retracement level around 153.50 with 3 upper fractals.
A break below the last lower fractal would be one reason to think this short term uptrend is over, another would be a fakeout over 153.50 followed by a close below.
A daily close above 153.50 would suggest the trade is not on for now and the trend could continue higher.
But that’s just what we think, how are you seeing things?
Send us a message and let us know.
Cheers!
Trade with WeTrade!
Every position closed is one step closer to unlocking WeTrade Honours privileges and redeeming exclusive rewards.
Start your trading journey here - Register now
Kickstart your trading of the week here - Login Now
Produced by Jasper and the Trading Writers team in collaboration with WeTrade.


