(U30 | EUR/USD | EUR/JPY)
U30 USD
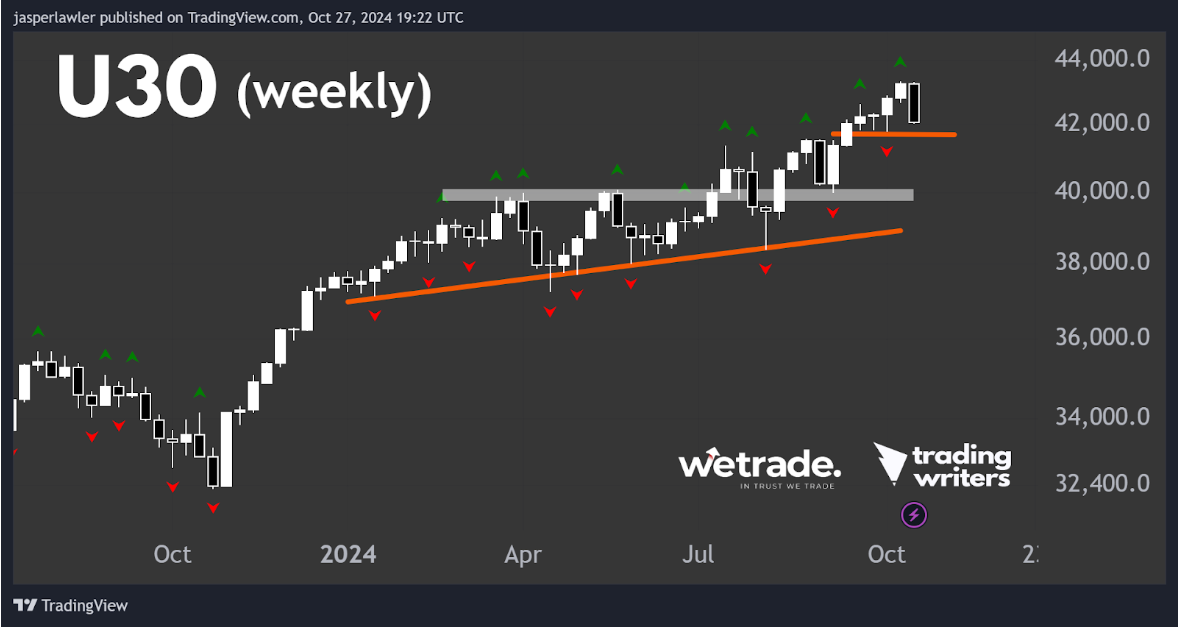
That was quite a bad week for the Dow Jones Industrial Average, and the U30USD CFD has put in a big bearish engulfing candlestick.
So is that it? The 1-year old bull market is over?
Not so fast. There was another bearish engulfing candlestick 8 weeks ago, 13 weeks ago and 23 weeks ago etc. And none of them reversed the trend.
That’s because candlestick patterns work best in line with the trend, not against it.
In our view, the long term uptrend is intact while above the 40,000 level.
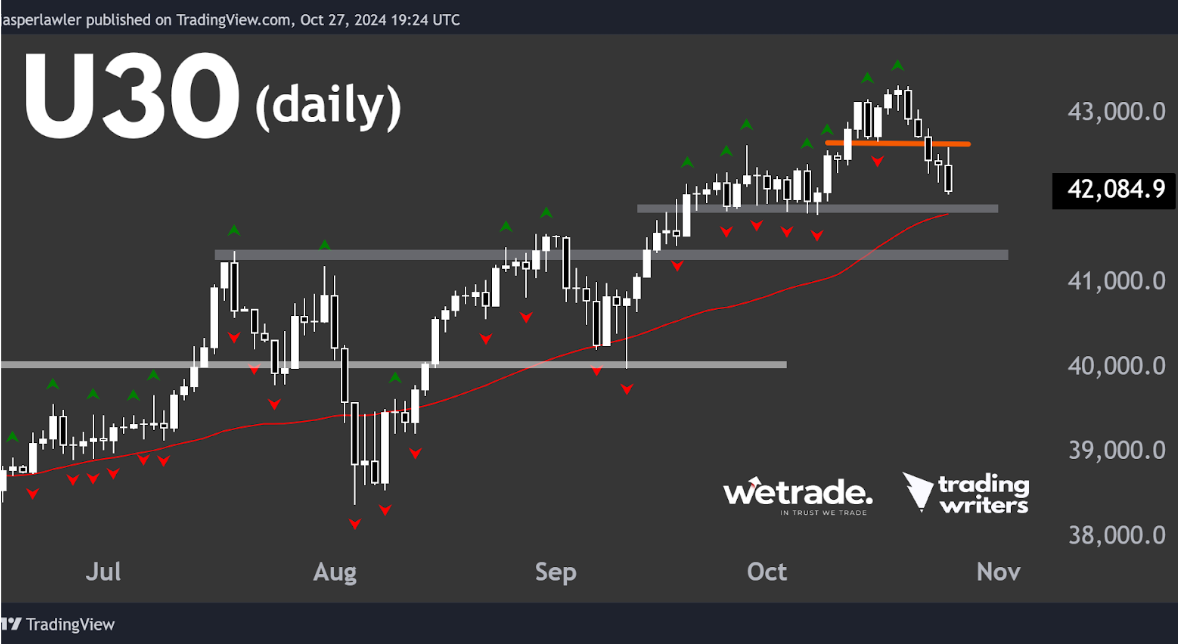
On the daily timeframe we see the steep decline over the past few days but still, even on the lower timeframe, it's still an uptrend with a rising 50 DMA and only one lower (red) fractal broken, and no lower highs.
The next formation of a lower fractal could call the bottom to this pullback, especially if above 42,000 and the 50 DMA. But even a drop under these to the 41,400-500 zone could work as former resistance turned support to create a rebound.
The bottom line is the trend is still up, so we will assume it will keep going up until there is more evidence that a top is in place. One bearish weekly candlestick pattern is not enough.
EUR/USD
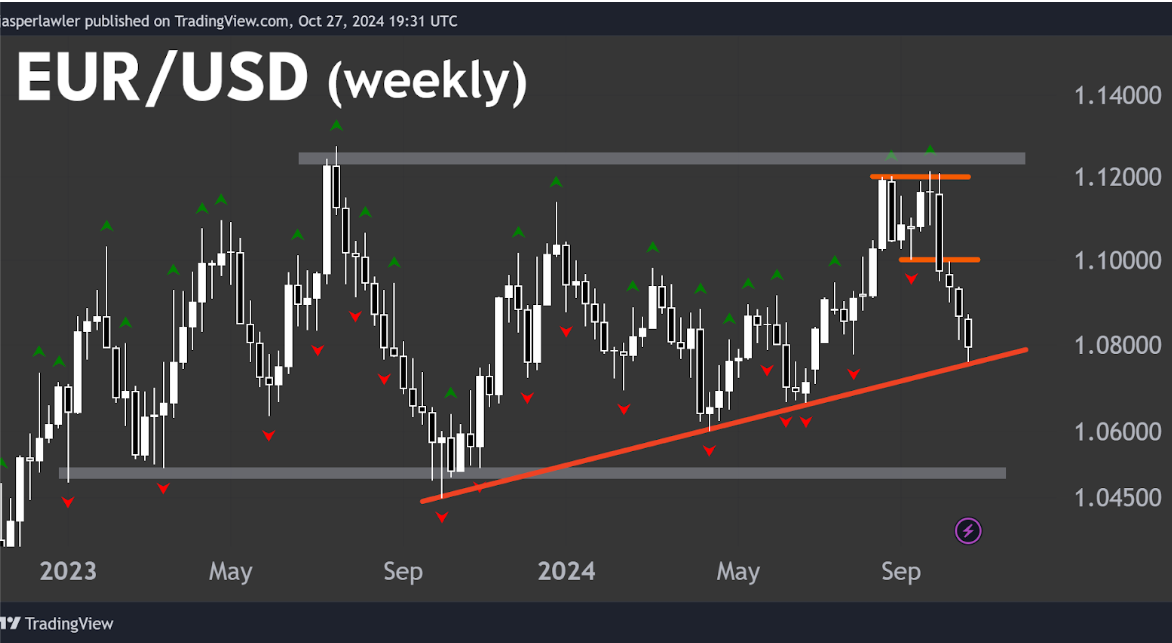
Technical analysis textbooks say that a trendline is valid once it has connected 3 lows. And that’s what we have in the EUR/USD weekly chart.
EUR/USD put in a double top at 1.12 and after a measured move lower of around 200 pips, it has slightly rebounded off the rising trendline with a longer lower wick to the last weekly candle.
The bigger picture is that the euro is range bound with the US dollar while in between 1.05 and 1.12, like it has been over the past two-ish years.
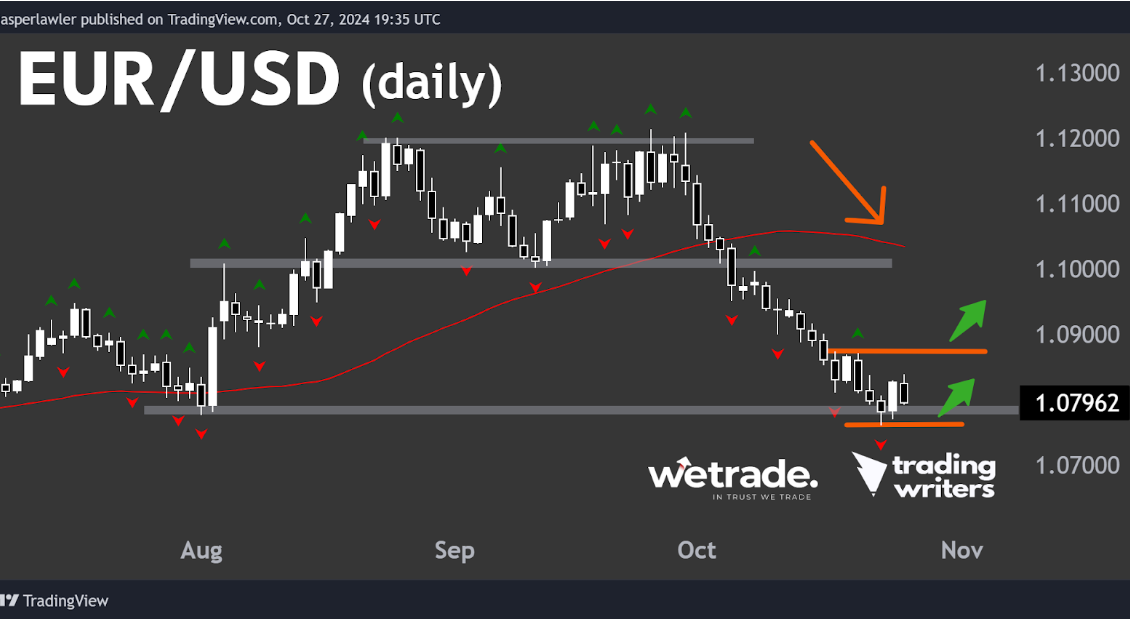
On the daily chart, we see the rebound coincides with a bounce off support from the August lows.
There is a bullish engulfing candlestick, at a support level.
It’s not clear if the bullish reversal will hold at all or if it does, how long it can last given that the trend for EUR/USD on the daily chart is clearly down.
Any reversal of the downtrend would gain added confirmation should it take out the last higher fractal just under 1.0875.
EUR/JPY
It’s all relative in forex trading.
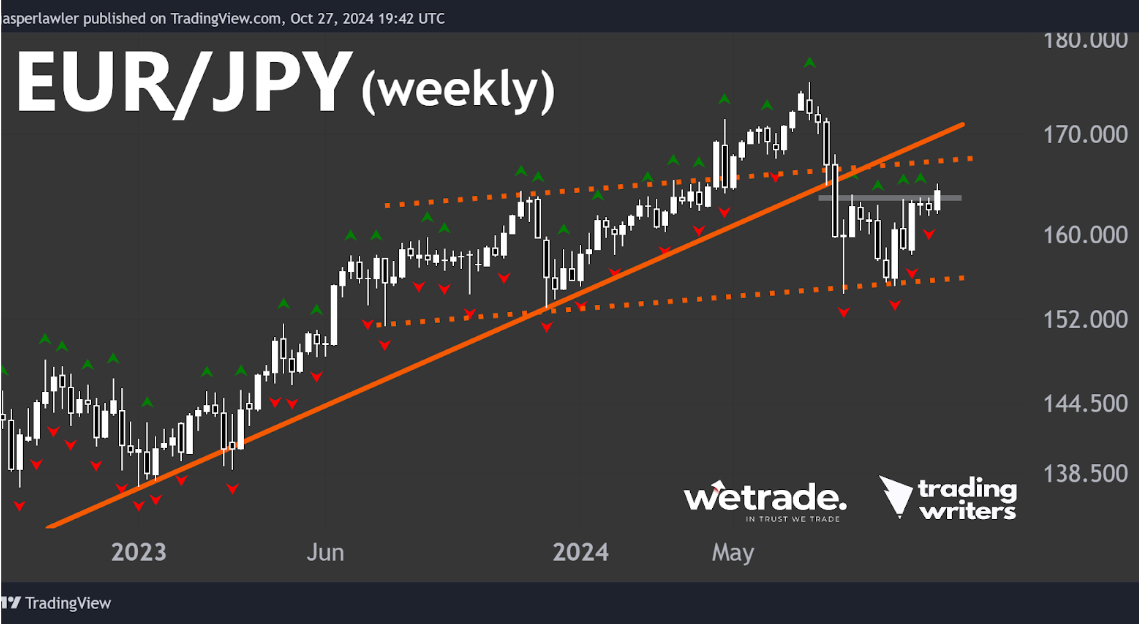
While weak against the dollar, the euro broke out last week vs the Japanese yen.
The last weekly candle closed above the prior 4 upper fractals all around 163.50-154.
While the longer term uptrend has lost momentum with the break of the rising trendline, it has still not definitely reversed.
It is also getting dangerously close to the head and shoulders pattern we first suspected in our analysis of week 41.
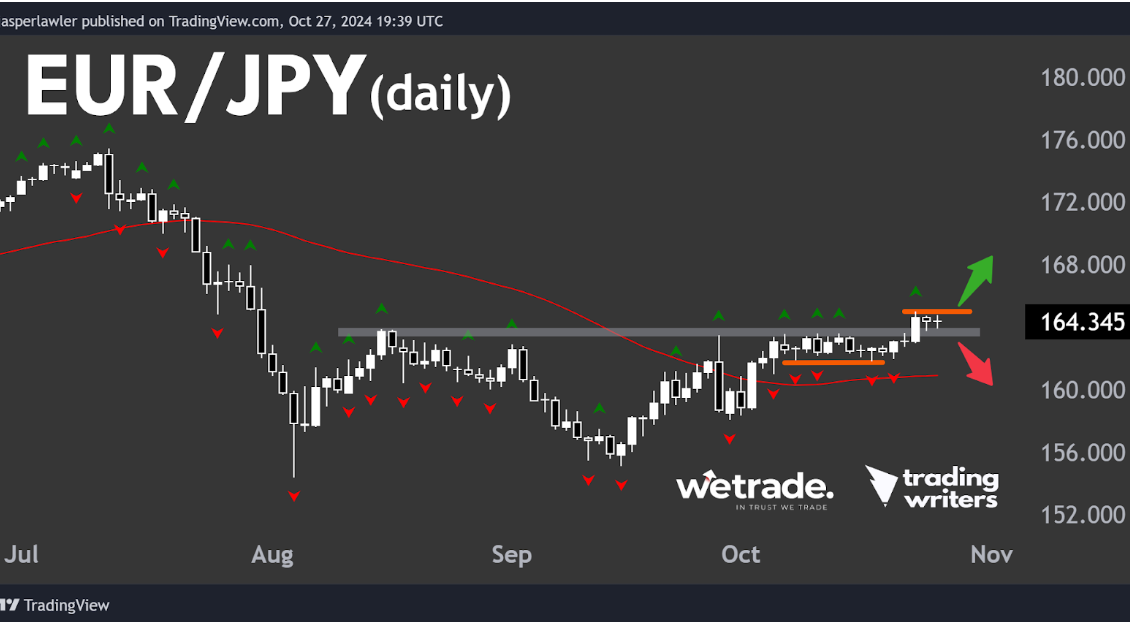
On the daily chart the break above resistance is much more clear.
A break above the two inside bars (haramis) would confirm the breakout, where as a close back under 163.50 would suggest a fakeout and move back down into the former trading range.
But that’s just what we think, how are you seeing things?
Send us a message and let us know.
Cheers!
Trade with WeTrade!
Every position closed is one step closer to unlocking WeTrade Honours privileges and redeeming exclusive rewards.
Start your trading journey here - Register now
Kickstart your trading of the week here - Login Now
Produced by Jasper and the Trading Writers team in collaboration with WeTrade.


