Brent Crude Oil
Candlestick patterns normally fail.
That’s not me bashing candlestick trading strategies - that’s just a fact.
The way to trade candlestick patterns is to put them in context on a chart. For us, the context comes down to A) the trend B) momentum and C) support & resistance.
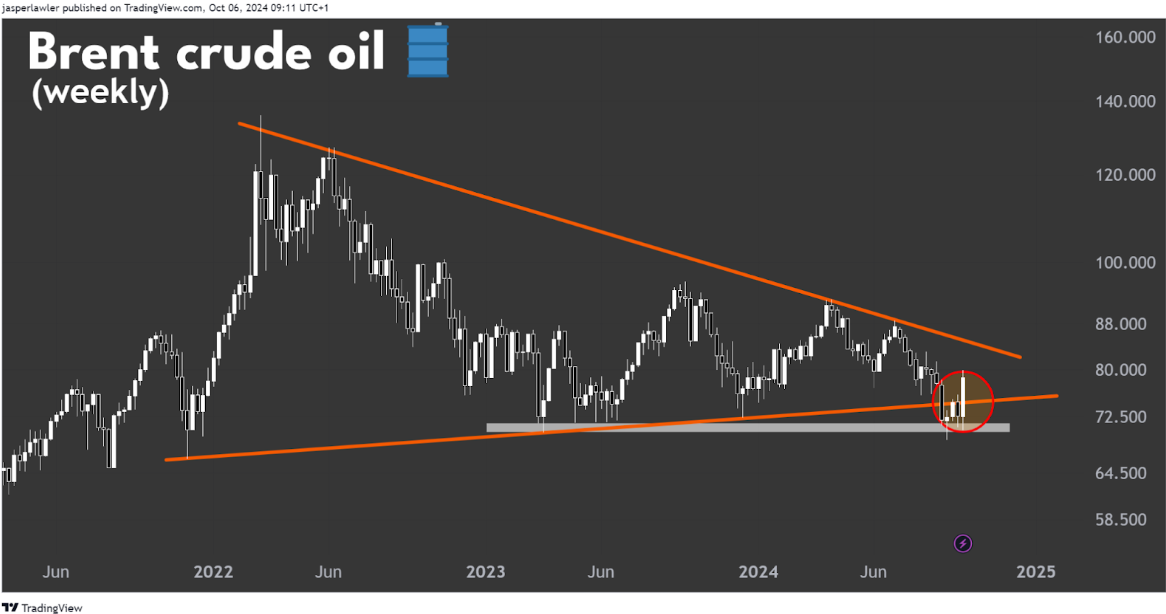
Specifically looking at the oil market, there has been a bullish weekly engulfing candlestick (circled in red) at support and at the bottom of a 10-week downtrend.
Do you see how the price broke below the triangle pattern, re-tested the breakout area, fell again - only to see a bullish reversal right back into the triangle again?
The price is telling us it's not yet ready to break lower.
In other words there was not enough conviction from the bears to keep selling. And if that’s the case, naturally next is to test the conviction of the bulls.
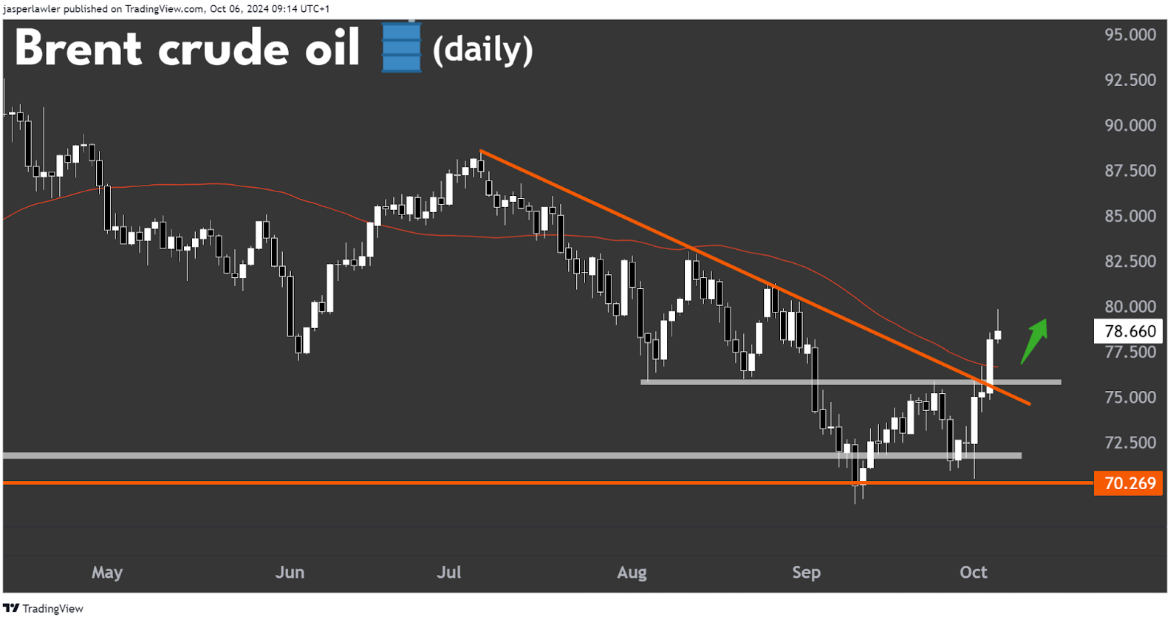
Dropping down to the daily chart we see this weekly bullish engulfing candlestick as price breaking above resistance around $75 and also breaking above a down trendline, marking the end of the downtrend.
The ‘breakout zone’ around $75-$76 has flipped into support, and given the price essentially rallied $10 from $70 to $80, then $75 would be a 50% retracement.
For the bulls to really get tested, the price could return to the start of this latest downtrend, and $88.
EUR/JPY
We will discuss EUR/JPY in a moment but it's worth noting how we talked about GBP/JPY in the previous two weekly updates and we noted both times how the currency pair was a lesson in testing your resolve.
Well nothing’s changed - despite initially dropping from the 186 ‘liquidity grab’ level discussed last week GBP/JPY has made another bullish reversal.
Naturally, all Japanese yen pairs are correlated and this is more true than ever at the moment because of the unconventional policies of the Bank of Japan.
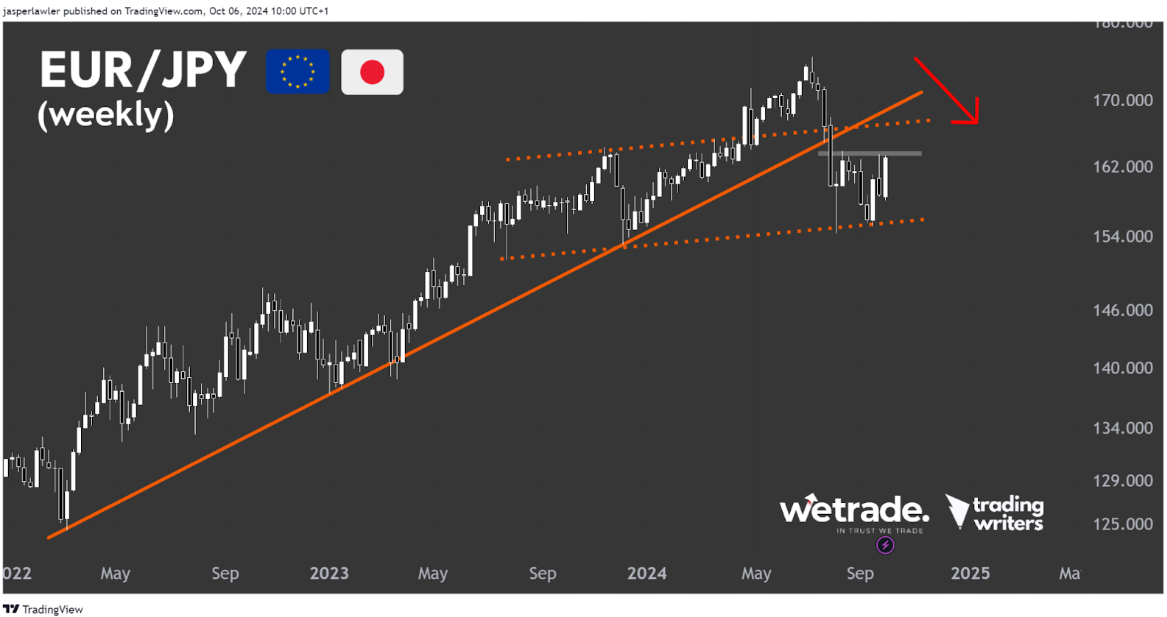
The weekly chart for EUR/JPY shows a broken uptrend line. The swift decline from multi-decade highs has left room for a large upside retracement, which appears to be underway now.
One potential scenario is the re-test of this broken trendline, which could create a head and shoulders top. This is purely speculative at the moment since the right shoulder has not formed, so the pattern has not even fully formed let alone completed.
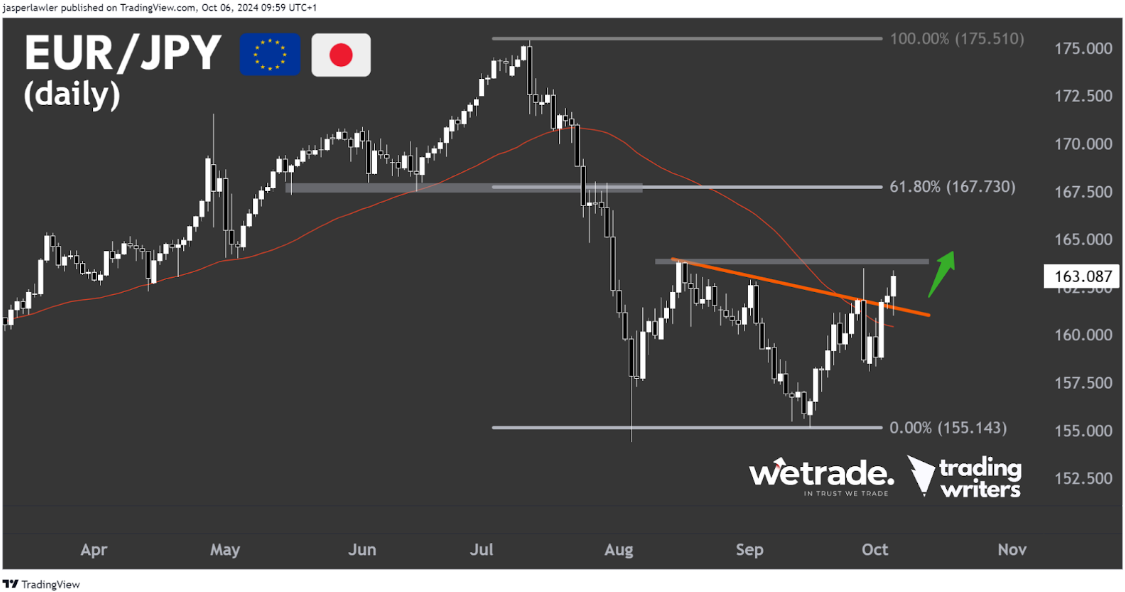
On the daily chart, there is a clear break of a downtrend line with a confirmed weekly close above it - unlike during the liquidity grab where the price broke higher but then closed the week under the trendline.
This broken trendline and Friday’s low at 161 is now support. Should the price be able to break above the August peak, a next possible upside target is 167.5 (the 61.8% Fibonacci retracement of July-August drop.
Gold
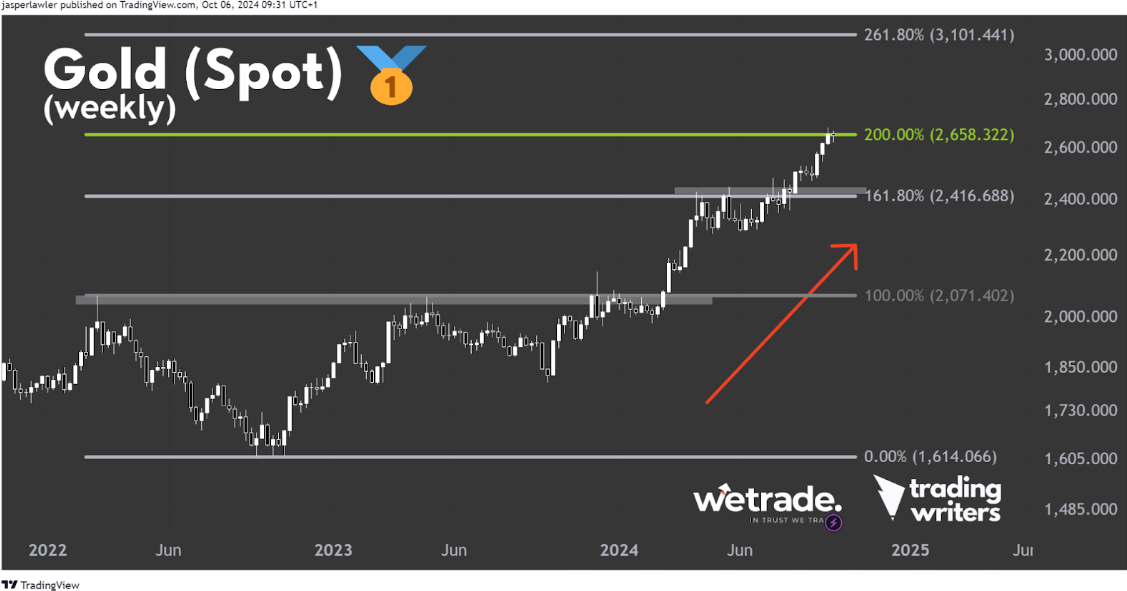
Gold has now reached the first Fibonacci extension target we outlined in week 38.
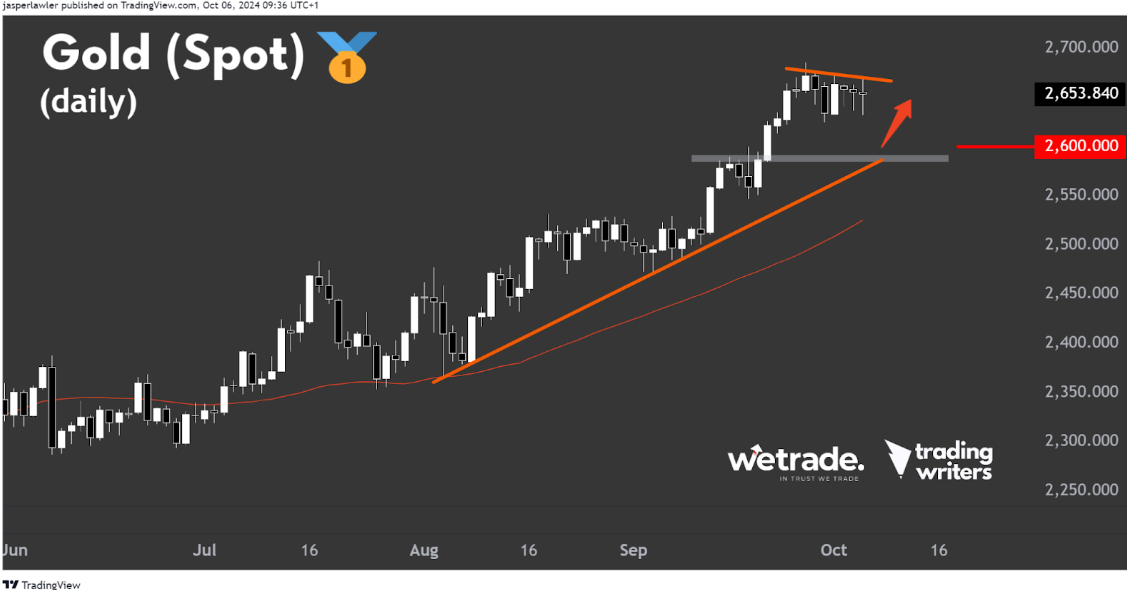
The uptrend is firmly intact but there is scope for a pullback from this area. If no such pullback happens it will demonstrate the conviction of the bulls, suggesting further upside.
Should such a pullback take place, the round number of 2600 as well as support from a rising trendline and the previous peak might be where it ends before the uptrend resumes.
Alternatively, a break above the near term flag pattern formed over the past 7 days would suggest no bigger retracement and immediate continuation of the strong uptrend - with $3100 per oz still in place as a potential long term upside target.
But that’s just what we think, do you agree or disagree?
Send us a message and let us know
Happy Trading!
Trade with WeTrade!
Every position closed is one step closer to unlocking WeTrade Honours privileges and redeeming exclusive rewards.
Start your trading journey here - Register now
Kickstart your trading of the week here - Login Now
Produced by Jasper and the Trading Writers team in collaboration with WeTrade.


