Silver (XAG/USD)
Sometimes (many times..?) an opportunity in the markets looks so good, that it’s probably too good to be true.
This may be one of those times for silver.
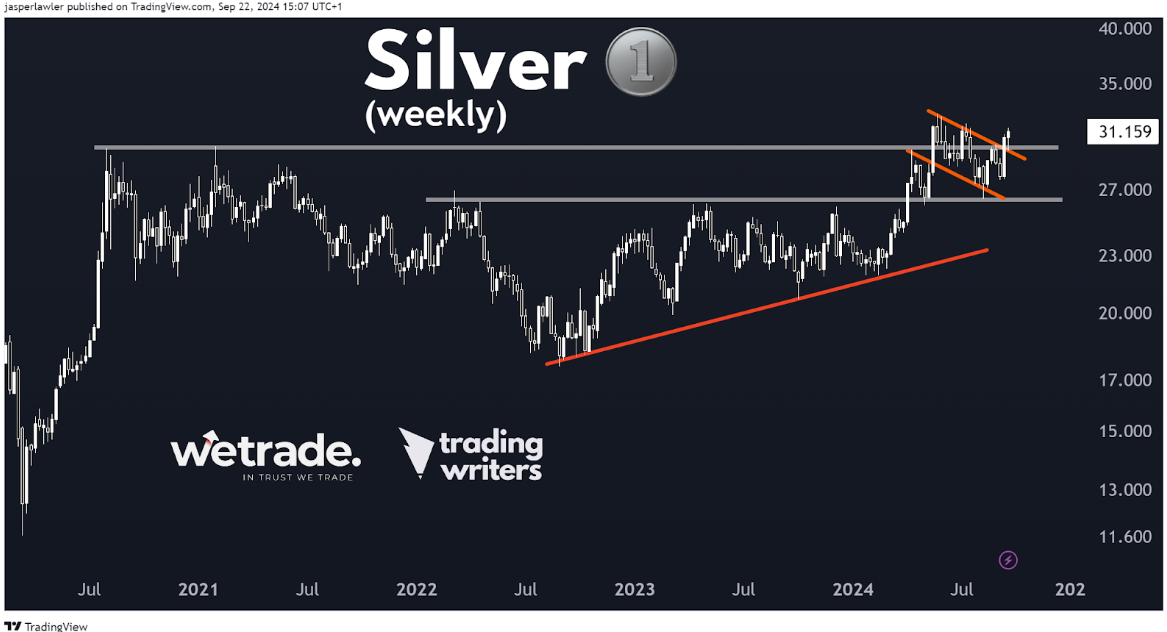
That big surge to the very left of the weekly chart (way back in 2021) was when there was speculation of a physical shortage in silver, and the price went berserk!
From a low of ~$11, the price surged to $30.
Alas, $30 marked the peak and silver has been range trading... Until now.
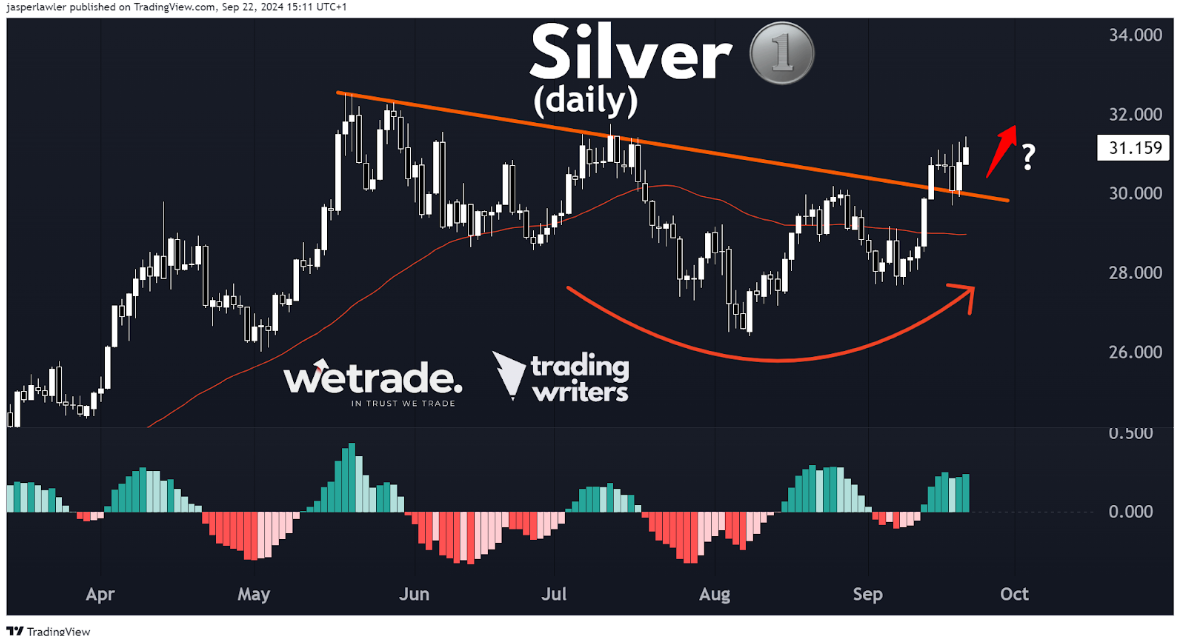
After an initial break over $30 in July, the price just completed a bull flag pattern with another weekly close over the important 30 level.
The trade is a continuation higher, the risk is another false break.
You can see the flag as a down trendline that just broke to the upside, re-tested the trendline and pushed higher again.
The 30 level is now support, so a move back below there and it’s time to sit on your hands again. $32.50 is the first resistance from the 2024 high.
Above there, the 161.8% Fibonacci on the drop since this year’s peak comes in at $36.00.
EUR/GBP
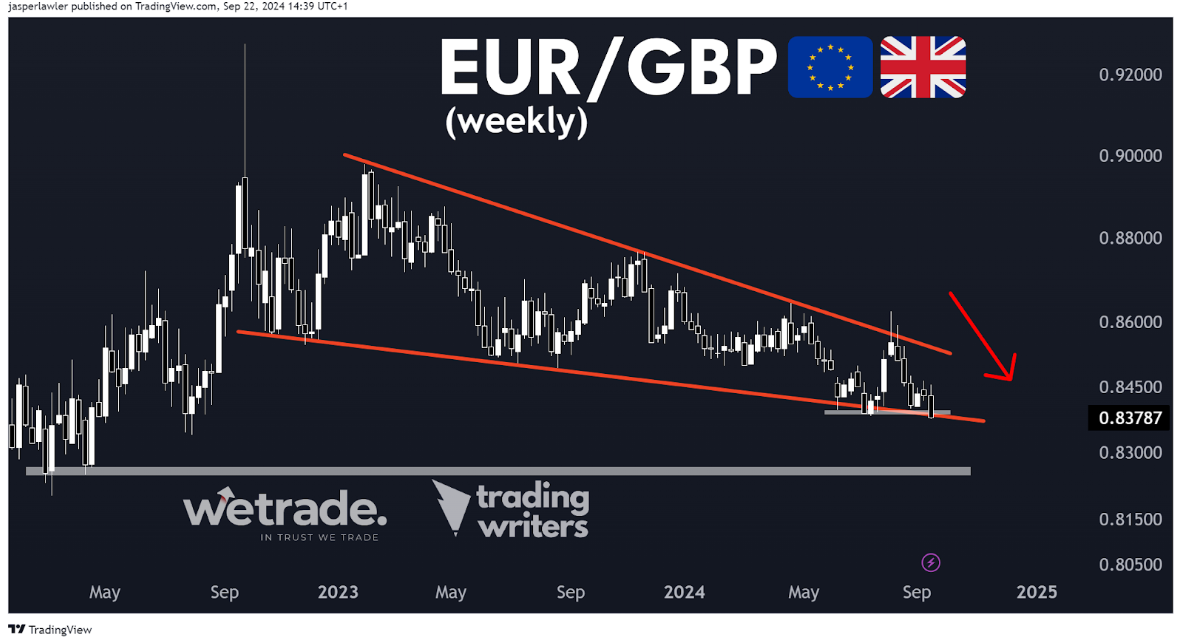
Starting with the first of our 2 GBP crosses, the Euro-Sterling cross just dropped to a 1-year low.
52-week lows and highs are always interesting.
This one is particularly striking because EUR/GBP was attempting a break to new 2024 highs just 7 weeks ago. Clearly, the breakout failed.
Failed breakouts are a pain when you’re trading the break BUT if you’ve got the presence of mind to close out your trade and trade in the other direction, they can be some of the most rewarding setups.
The weekly shooting star candlestick pattern at resistance was the early bearish signal.
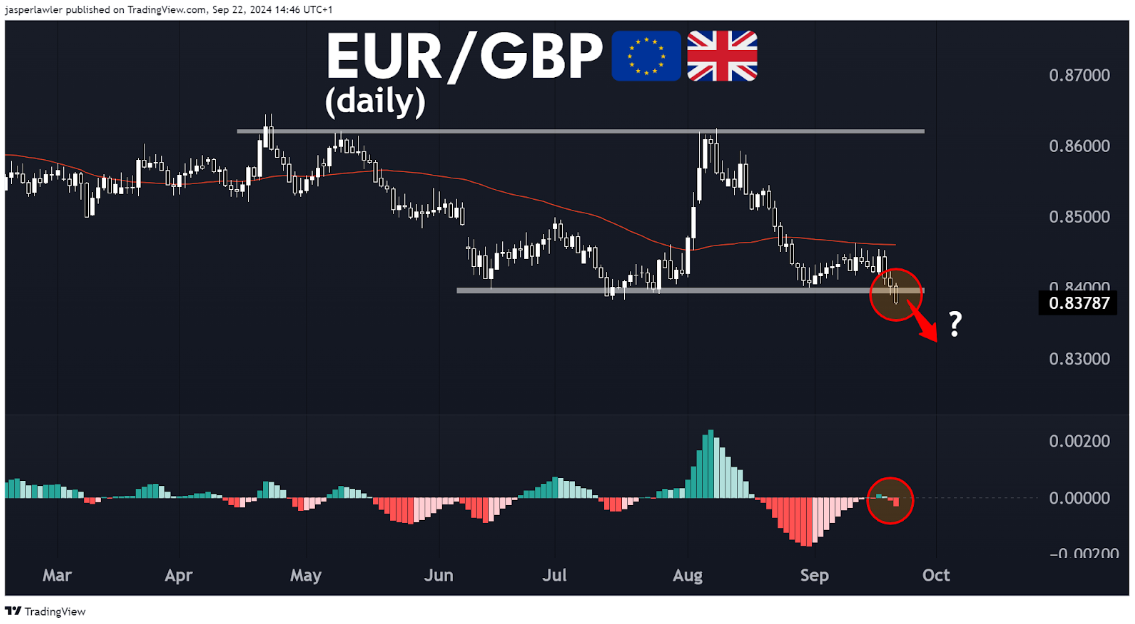
The break below support last week was the signal the bearish trend will continue (of course it might not continue!)
On the daily chart it’s a pretty clean break of support at 0.8400, which is now resistance with last week’s high the next resistance (R2) at 0.8450.
The February 2022 at 0.8200 is the major downside target, with a 0.8250 a logical area where traders might take profits.
If the breakdown doesn’t pan out, it sets up trade back into the 0.84-0.86 trading range.
GBP/JPY
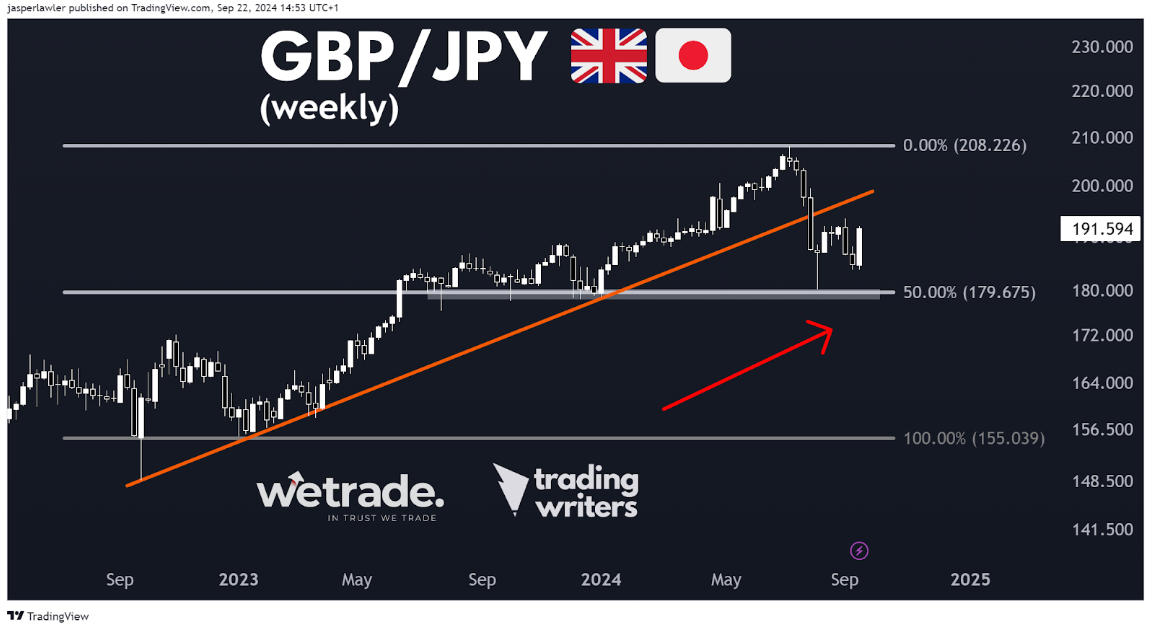
The British pound / Japanese yen cross offers a good example of patience as a virtue.
Those who bought into the hammer reversal candlestick pattern on the weekly chart have had to endure 5-6 weeks of losses, but are now either in profit or breakeven.
The bigger picture for GBP/JPY isn’t too clear - while the long-term trend has been up, the break of the rising trendline would suggest the uptrend has finished.
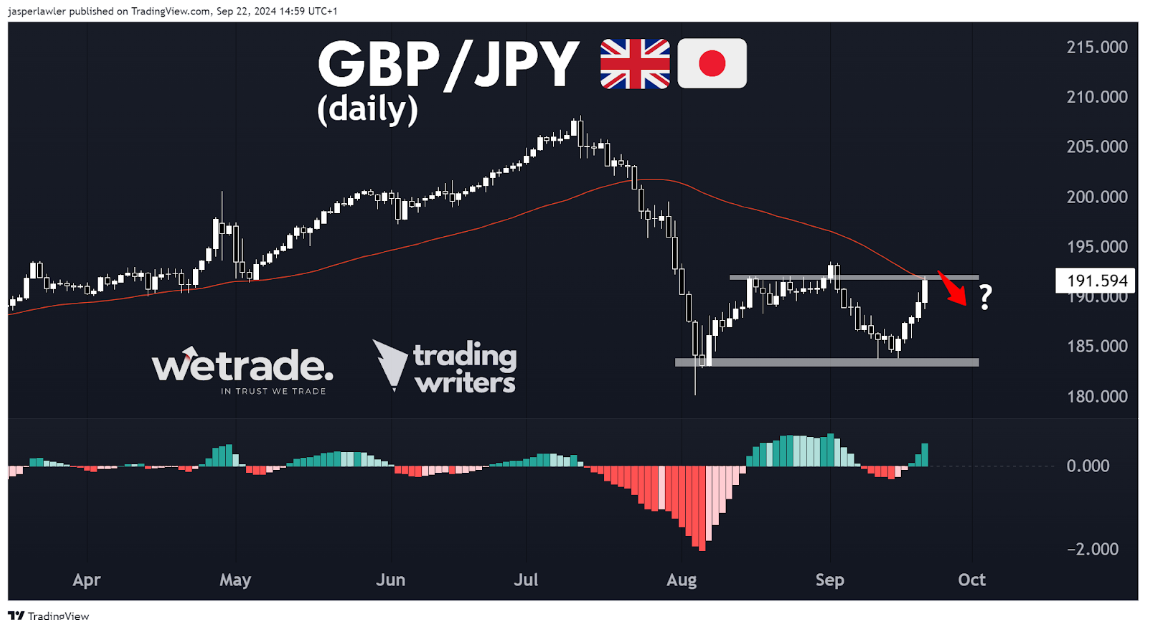
In the short term, we’re inclined to look for a classic reversal of a 5-week rally at resistance.
Should the price break above, but then close the day below 192, it would imply a drop further back towards the 187-188 area, if not back to the low at 184.
But that’s just what we think, do you agree or disagree?
Send us a message and let us know
Happy Trading!
Trade with WeTrade!
Every position closed is one step closer to unlocking WeTrade Honours privileges and redeeming exclusive rewards.
Start your trading journey here - Register now
Kickstart your trading of the week here - Login Now
Produced by Jasper and the Trading Writers team in collaboration with WeTrade.


