US 500
Who needs to be original anyway? Let’s talk about the most widely followed market price in the world - the price of the S&P 500 index.
And let’s combine that discussion with one of the best-known technical analysis price patterns - the double top.
The textbooks say the double top is ‘completed’ when the price breaks below the first low- and to be clear, that hasn’t happened yet in the S&P.
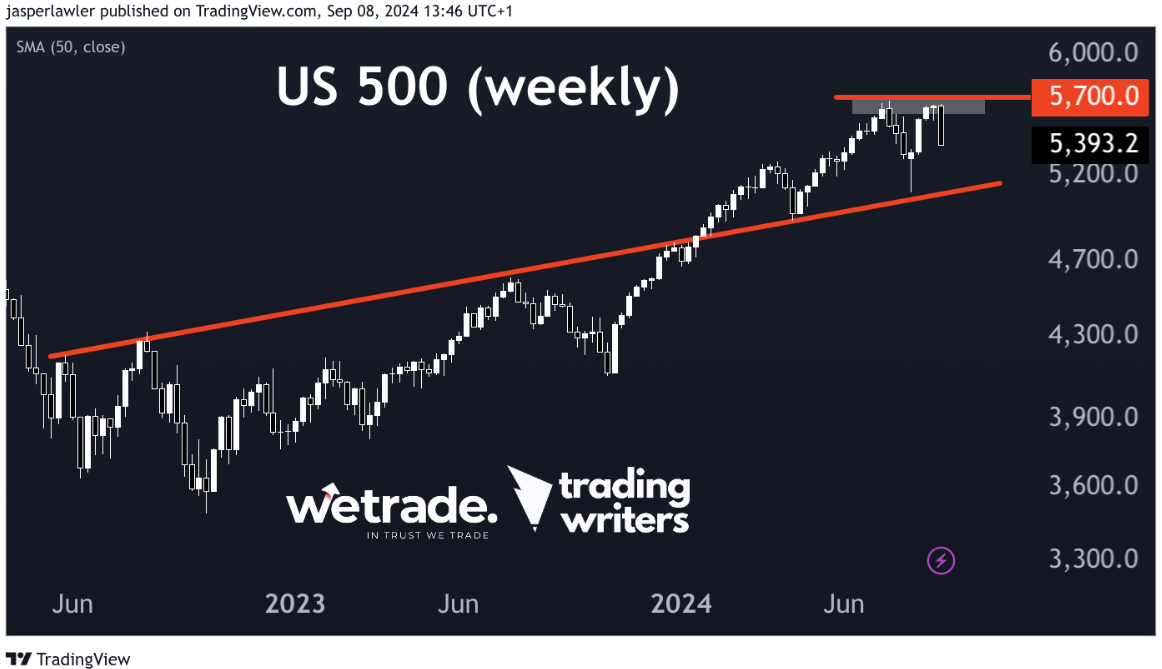
What has happened is that the average price of the biggest 500 stocks in America just reversed for a second time at the 5700 level.
Not only that, it was the worst week of the year. We can see this as the big bearish engulfing candle on the weekly chart.
So in summary, the setup we get from the weekly chart is a big bearish engulfing week at resistance - that’s bearish.
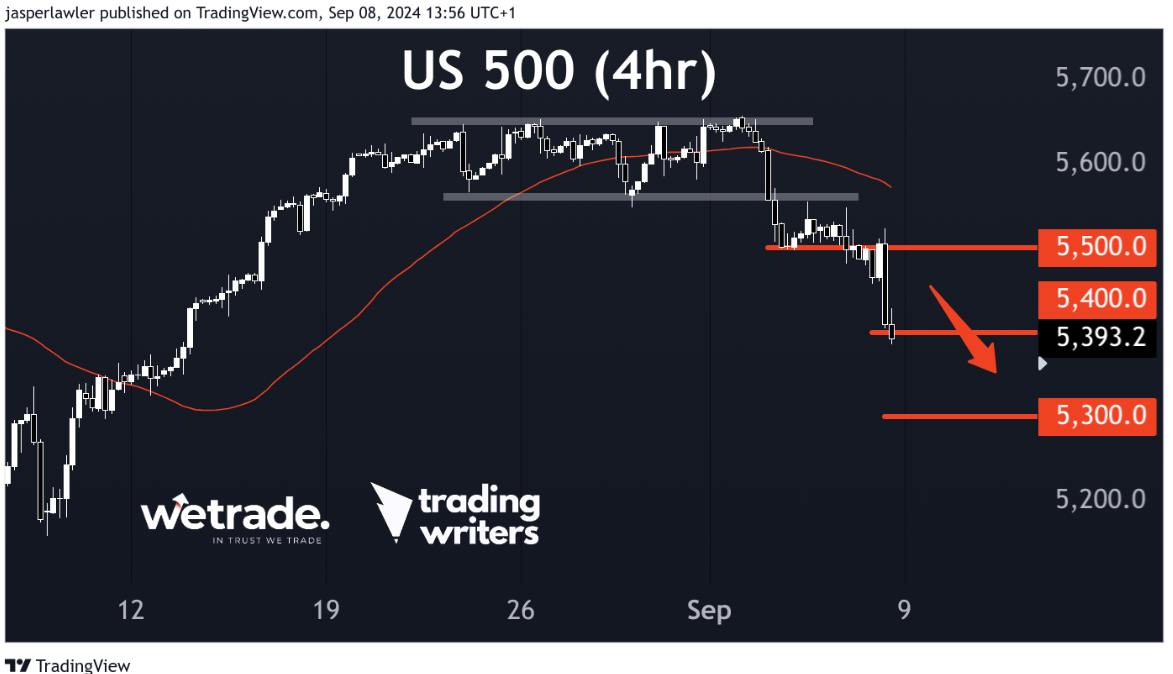
On the 4-hour chart, the trend has already turned lower. The first test for the new downtrend was 5500, that broke and now we are near 5400. Naturally, 5300 would be next IF the downtrend resumes.
We don’t know if it will resume or not - we just know that the setup on the weekly chart is bearish and that tilts the probabilities in favour of a continuation lower.
Looking past the price action and to the possible mindset of the traders causing it, after a big weekly drop, there will be some traders trying to pick the bottom. That could create the kind of upward movement to set up opportunities to the short side below 5500 with 5300 as a possible target.
WTI Oil
It was also a bad week for oil. And that’s no coincidence - both oil and stocks work in the ‘good times’ and tend not to work in the ‘bad times’.
OK, times are not that bad but it's seasonally the worst time of the year (September and October are on average the worst months for stocks over the last 100 years), and there’s the US election coming up to cause some uncertainty.
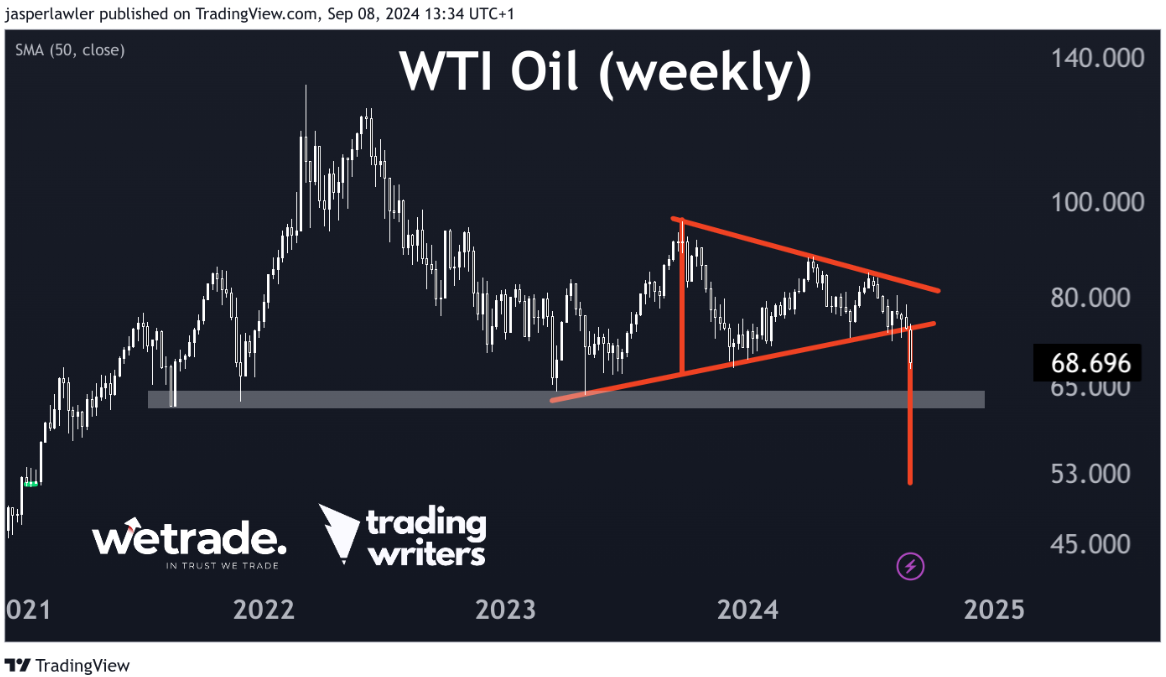
WTI crude oil futures have broken to the downside of a triangle pattern - that’s bearish and means we will favour bearish setups on lower timeframes.
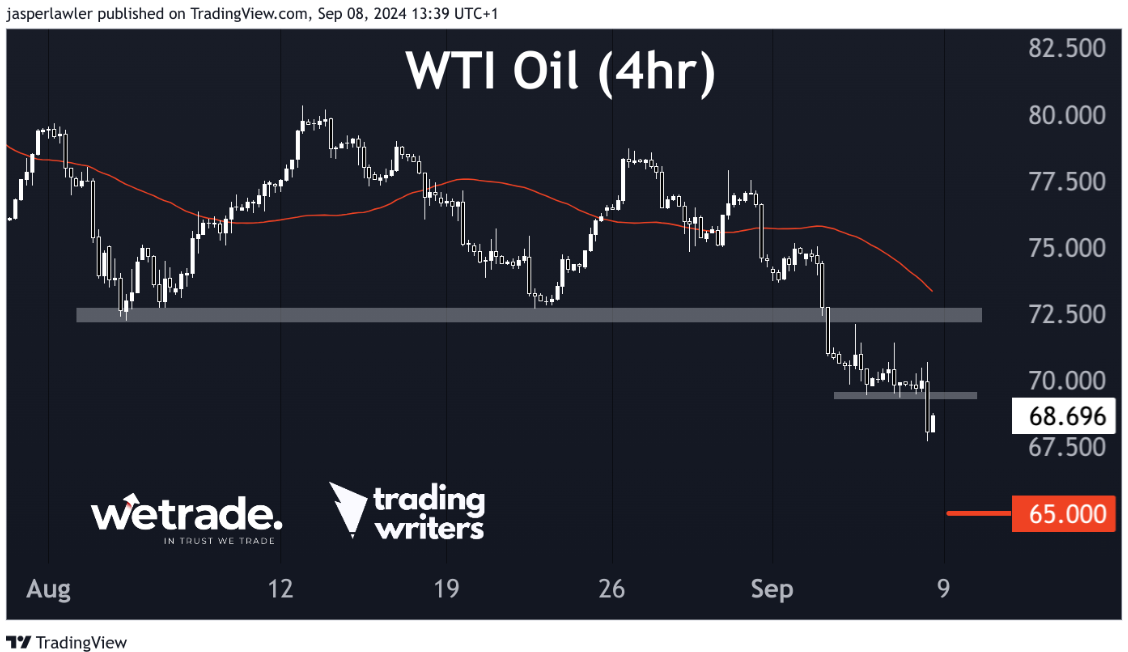
The 4-hour chart shows support broken at 72.50 and again at 70.0.
The more conservative entry to any new short positions is at the former with aggressive entries to be found at the latter - with 65.0 one target below ahead of the weekly support level and well before the objective of the triangle pattern around 51.0.
GBP/USD
And just to round things off, we have another “goes lower in the bad times” asset - this time in the forex market - GBP/USD.
USD is the haven currency and GBP for whatever reason is deemed more risky.
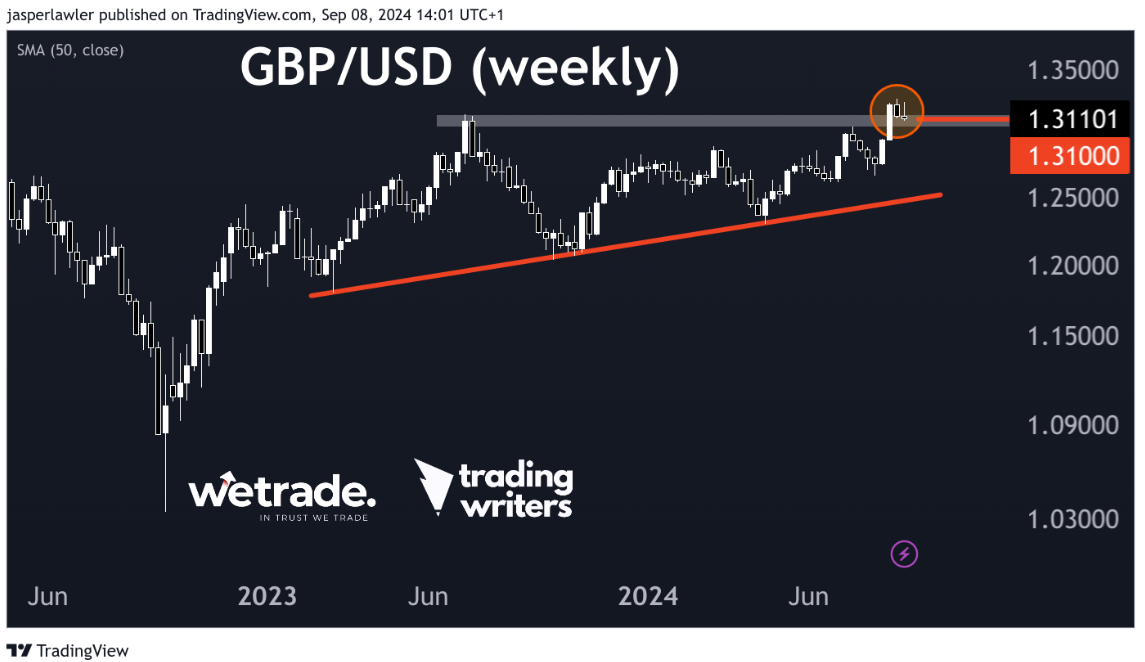
GBP/USD has broken out to multi-week highs but stuttered since.
This could be a natural pause before the upside moment resumes or this is a ‘fakeout’ and we’re heading for another test of the rising trendline on the weekly chart.
We’d prefer not to guess which one it is but rather wait and see.
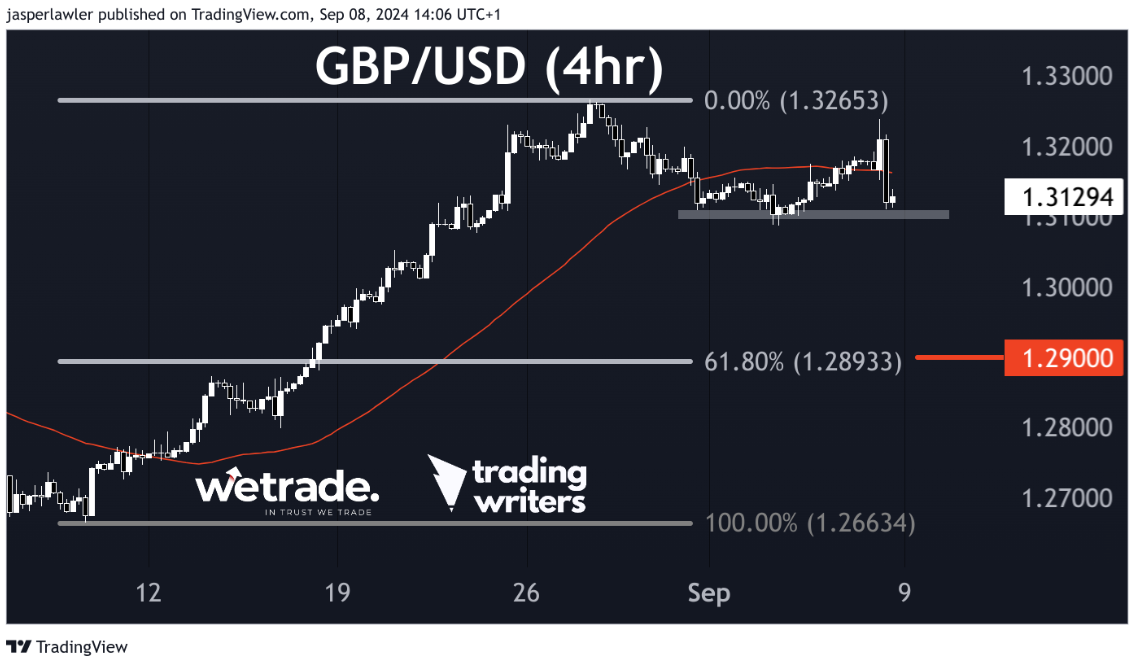
The 4-hour chart shows a large bearish engulfing candle at the end of the week, adding bearish momentum to the weekly ‘indecision’.
A break below support at 1.31 would open up a much bigger pullback with 1.29 sitting just above the 61.8% Fibonacci retracement level.
But that’s just what we think, do you agree or disagree?
Send us a message and let us know.
Happy Trading!
Trade with WeTrade!
Every position closed is one step closer to unlocking WeTrade Honours privileges and redeeming exclusive rewards.
Start your trading journey here - Register now
Kickstart your trading of the week here - Login Now
Produced by Jasper and the Trading Writers team in collaboration with WeTrade.


