Silver (XAU/USD)
Did you have one of those best friends at school where you’d always be just a little bit competitive? Sometimes you’d win and sometimes they would.
Well, gold’s bestie is silver.
We talked last week about gold closing out the week with a new all-time high (ATH) and with a weekly close over $2500 per oz for the first time. We said it's a “massive deal”.
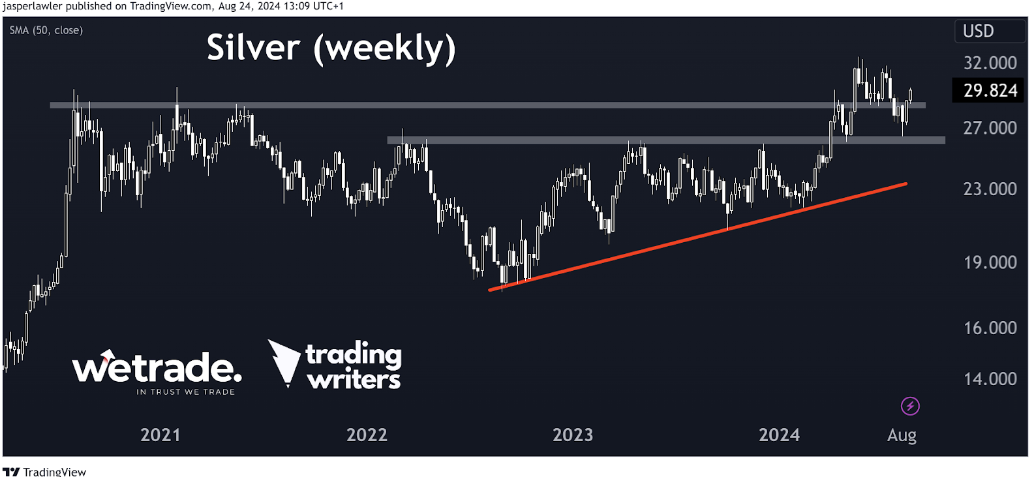
Silver is pulling back from multi-decade highs around the key $30.00 psychological level. It’s psychological because people naturally pay attention to big round numbers.
Traders would have had a valid reason to buy the first dip to $29 but it didn’t work out.
The next leg lower has taken the price down to around $27, the resistance going back to the start of 2022. From support at $27, the price put in an engulfing candlestick. This is exactly the kind of setup we want to see to start looking for bullish trades in a lower time frame.
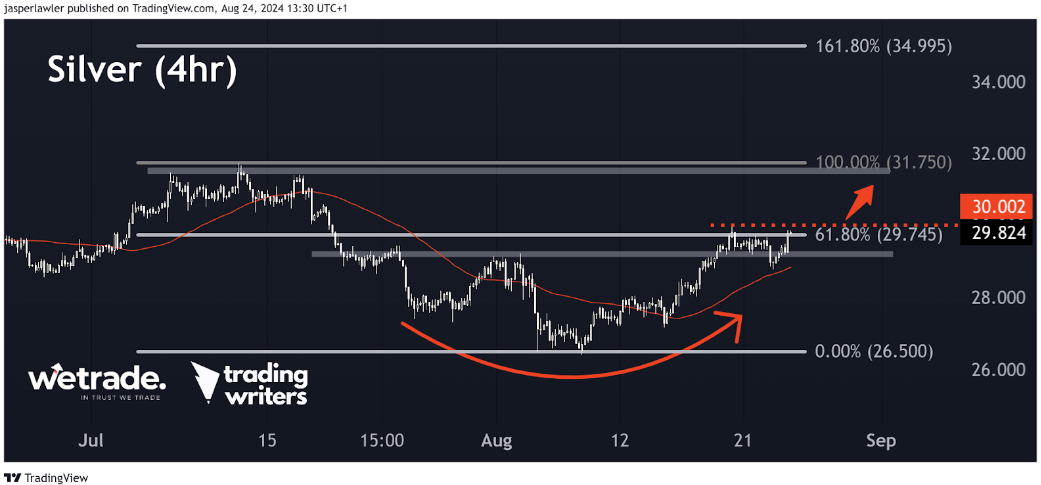
Dropping down to the 4-hour timeframe - we can see the bottoming process that helped form the bullish engulfing pattern on the weekly chart.
A follow-through on the breakout over $30 should naturally challenge the former highs around $31.75. A breakout over $32 might take a bit longer to achieve, but were it to happen - one possible upside target is the 161.8% Fibonacci extension almost right at $35.
Nvidia (NVDA)
Probably the biggest event for the stock market next week is the earnings from AI heavyweight Nvidia. When there is such a spotlight on some news, it is often not the best place to be trading (without inside information!).
Still, for those who already own the stock - or are looking for an opportunity to do so - let’s take a look at NVDA.
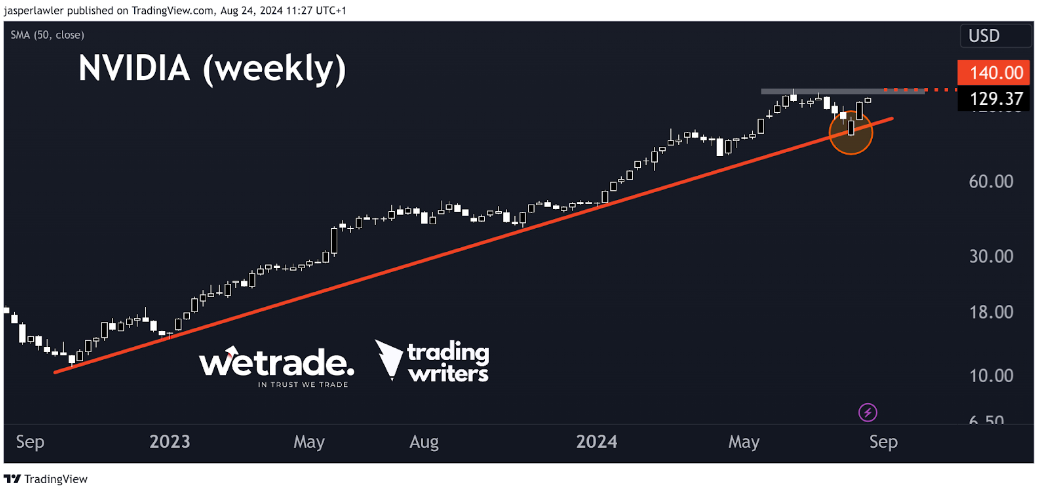
This is a logarithmic chart of Nvidia. For higher time frames like weekly and above, if your chart is sufficiently zoomed out, a ‘log chart’ helps you think about the price movement in more like percentage terms than actual terms.
Think about it. Which would feel like a more significant price move to you (and your wallet) a $15 move from $15 to $30 (100%) or a $50 move from $90 to $140 (55%)?
On the log chart, NVDA just about held onto a long-term uptrend line. And is now making its way to test all-time highs around $140.
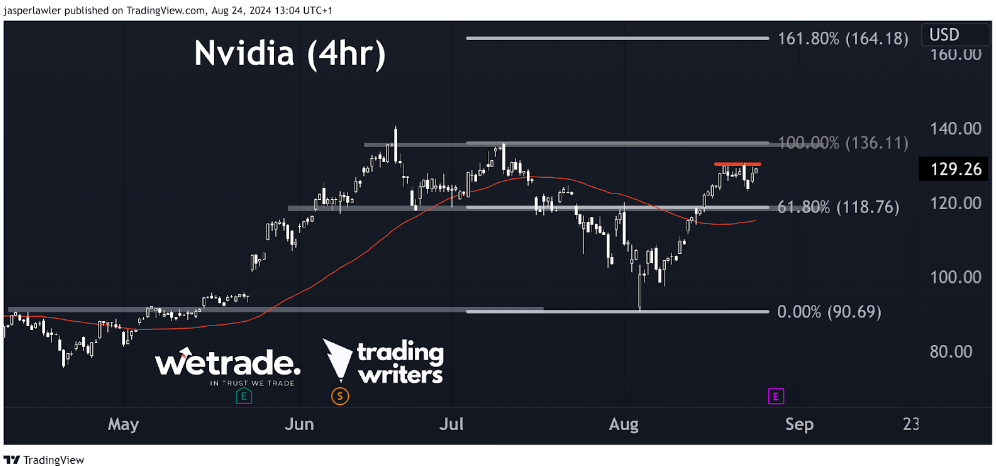
On the 4-hour timeframe we can see the strength of the really off-the-lows ahead of earnings this week, and that over the past day or so, the price has consolidated below the $130 round number.
It’s generally not advisable from a risk/reward perspective to buy a stock after a huge rally below major resistance like an all-time high. It could certainly work out a few times but the times when it doesn’t will probably outweigh those that do.
Shorter-term we would still be bullish on Nvidia while the price is closing above $118, a mirror level that has acted as support and resistance and is also the 61.8% Fib retracement of the drop down to $90.
Entering a new bullish position can really only be justified with a new closing record high. Should that happen, the next upside target would be the 161.8% Fib extension at around $164.
EUR/USD
The FX majors (i.e. all the pairs with USD) have been rising of late - precisely because the USD has been falling. There has been a general theme of USD weakness, which by the way has also been helping commodities like gold, silver as well as stock indices.
Without diving into the ‘fundamentals’ too much - the Federal Reserve has signposted it is about to cut interest rates - right before the US election in November.
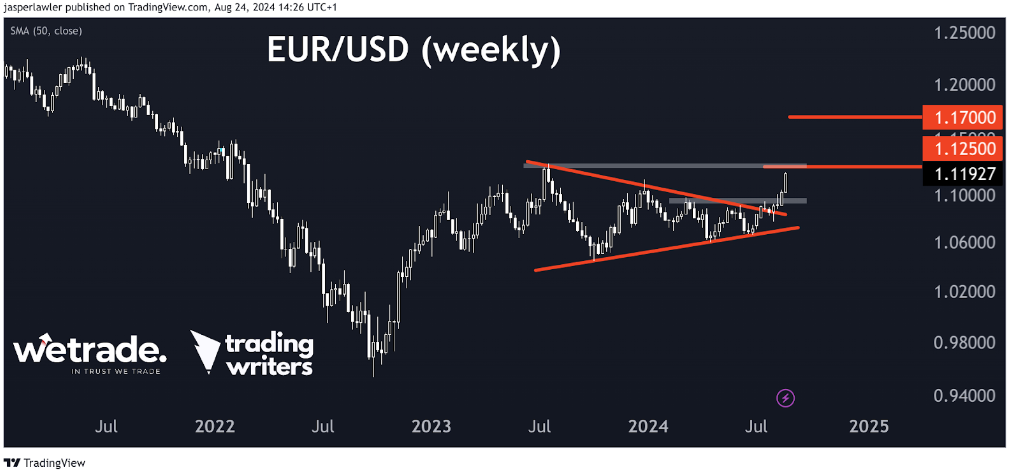
For the biggest major of them all by trading volume - EUR/USD - this dollar weakness has manifested as an upside breakout from a triangle pattern.
Using the height of the triangle pattern, the upside objective from this breakout would be 1.17. But we need to be careful not to get ahead of ourselves!
There is major resistance at 1.125, and it would be perfectly reasonable to expect that this resistance could ‘resist’ further upside in the price.
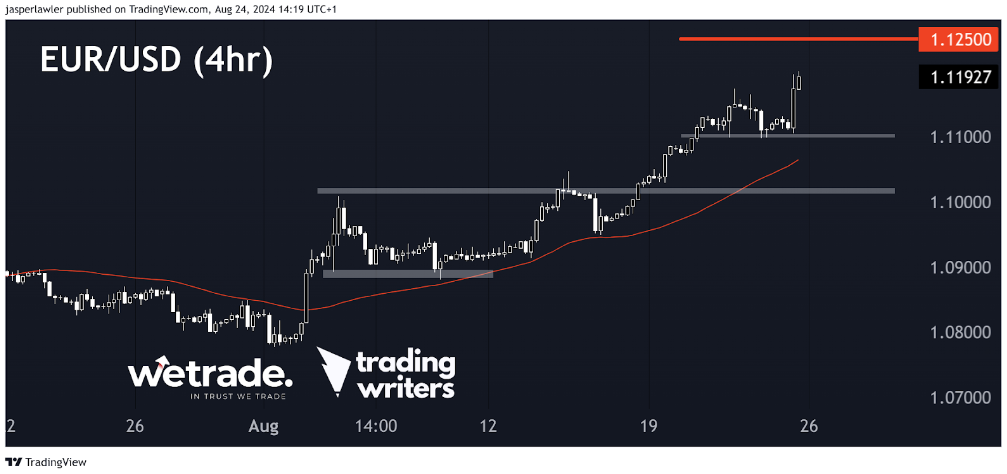
The 4-hour chart shows EUR/USD moving higher in a series of logical steps, which round numbers from 1.08 to 1.09 to 1.11 acting as support before the next leg higher.
Going short in an uptrend is not our style. We want to buy in uptrends. This 4-hour chart is a clear uptrend. For those of us already long EUR/USD then 1.125 is a place to consider selling.
For those of us looking to enter a trade, we think ‘sitting on your hands’ is the better trade than trying to go short here. As we said before, it could easily work going short here - but over the long term, repeating this trade over and over - in our experience - it loses you money because just like downtrends usually keep going down, uptrends usually keep going up.
What do you think about our ideas? Do you agree/disagree?
Let us know by leaving a comment or by contacting customer support. Happy Trading!
Trade with WeTrade!
Every position closed is one step closer to unlocking WeTrade Honours privileges and redeeming exclusive rewards.
Start your trading journey here - Register now
Kickstart your trading of the week here - Login Now
Produced by Jasper and the Trading Writers team in collaboration with WeTrade.
As a part of our 9th-anniversary celebration, we're giving away up to 90,000 USD in cashback from 1 to 31 August 2024. New clients will receive 2 USD cashback for every standard lot traded, subject to a maximum of 60,000 USD. Meanwhile, existing clients can earn 2 additional Reward Points per traded lot, capped at 30,000 Reward Points.
Additionally, you can unlock up to 30,000 USD in tiered cash reward packages too! For more information, see here.


